Vestibology
Vol. 45: Issue 2 - April 2025
Utility of MRI quantitative analysis in assessment of audio-vestibular impairment
Summary
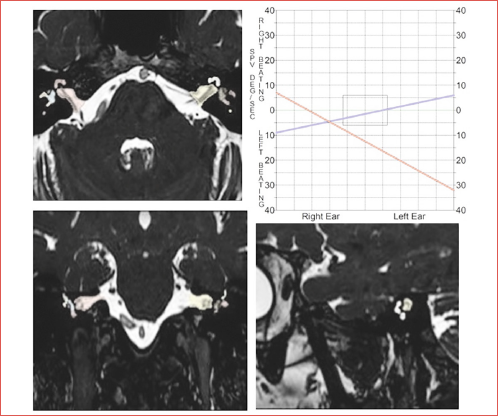
Cover Image
Objectives. To quantify inner ear fluid changes in patients with audiovestibular deficits by measuring signal intensity values; to correlate the signal intensity values of inner ear structures and audio-vestibular impairment severity.
Methods. 26 patients with unilateral vestibulocochlear deficits underwent hearing and vestibular assessments and were categorised into severity classes using audiological and vestibular deficit scores. Normalised signal intensity values of inner ear structures were extracted from 3D-T2-WI-MRI scans (nT2mean, nT2Max, nT2min) and signal intensity ratios were calculated using the unaffected ear as a reference.
Results. Asymmetry ratios of nT2Max and nT2mean volumetric intensity values from the cochlea and entire inner ear discriminated severe hearing impairment from lesser deficits and diagnostic performance of nT2mean values was excellent.
Conclusions. Quantitative MRI analysis may be a useful tool to assess the severity of auditory deficits. Asymmetry ratios of nT2mean and nT2Max signal intensity values derived from the cochlea and entire inner labyrinth are surrogate indicators of unilateral cochlear-vestibular deficits and may have potential prognostic value.
Introduction
Acute unilateral vestibulopathy (AUVP) and sudden sensorineural hearing loss (SSNHL) are acute dysfunctions of the peripheral vestibular and/or cochlear system 1,2. AUVP manifests as an acute syndrome resulting from unilateral loss of peripheral vestibular function without other neurological symptoms or signs 3.
Conversely, SSNHL is characterised by a sensorineural hearing loss, exceeding 30 dB across 3 consecutive frequencies, occurring within a timeframe of less than 3 days, with or without associated vestibular dysfunction, tinnitus and/or ear fullness 4,5.
Disturbances of peripheral cochlear and vestibular function may occur simultaneously, and the term ‘neurolabyrinthitis’ has been proposed 1,6.
MRI of the brain, including the inner ear, is the recommended neuroradiological examination for any patient presenting with a vestibulocochlear deficit 7. Conventional pre- and post-contrast weighted sequences (T1, T2, DWI and 3D-T1 post-contrast administration) along with high-resolution gradient-echo T2-weighted sequence (FIESTA, CISS) are used to rule out benign or malignant tumour of the cochlea-vestibular nerve, inner ear malformations, or brainstem infarctions 7. Advanced imaging techniques such as optimised non-contrast and contrast three-dimensional fluid-attenuated inversion recovery (3D-FLAIR) sequences provide an additional clue to reveal the underlying cause of the vestibulocochlear deficit 8, because they can detect subtle signal intensity changes in the intralabyrinthine fluid 9. Nevertheless, although 3D-FLAIR sequences have a high sensitivity to identify inflammatory processes undetectable on three-dimensional fast spin echo (3D FSE) and gradient-echo T2-images, they are also more vulnerable to artefacts from inflammatory processes 10. Furthermore, even when employing advanced imaging techniques within an early time frame, visual imaging findings may be negative, and a normal qualitative examination is insufficient to rule out a clinical diagnosis of inner ear impairment 11. A volumetric analysis of the inner ear structures based on 3D heavily T2-weighted sequences represents an interesting addition to accurately quantify subtle changes in the fluid composition of the inner ear. To date the results of clinical and radiological studies in unilateral audio-vestibular diseases are somewhat contradictory and the relationship between clinical and MRI findings is not completely understood because of methodological differences, assessment criteria for hearing loss levels or vestibular deficits, and the variable time frame between the onset of symptoms and the initial MRI 12-15.
Most studies have primarily focused on the prognostic value of clinical symptoms and laboratory findings often overlooking MRI results2-4,6. Only a limited number of studies have explored the predictive value of MRI-detected endolabyrinthine fluid abnormalities in cases of unilateral vestibulocochlear deficits and these have predominantly relied on qualitative and semi-quantitative analyses and involved small cohorts of patients 8,9,16. Furthermore, no previous study has assessed the accuracy of volumetric signal intensity of heavily T2-weighted sequences in detecting subtle signal alterations within the inner labyrinth in patients with vestibulocochlear deficits.
The primary objective of this study was to assess whether signal intensity volume values of inner ear structures, obtained from heavily T2-weighted sequences, can be used to detect early changes in the intralabyrinthine fluid in patients with unilateral acute vestibulocochlear deficits. The secondary endpoint was to investigate the relationship between signal intensity values and the severity of audio-vestibular deficits.
Materials and methods
Patients
From June 2018 to September 2023, 45 adult patients who presented with AUVP and/or SSNHL underwent hearing assessment and MRI of the inner ear with intravenous contrast agent.
All patients met the following inclusion criteria:
- Clinical examination criteria for AUVP: acute onset of vertigo with symptoms lasting for at least 24 hours, spontaneous nystagmus with a direction-fixed pattern enhanced by removal of visual fixation and/or reduced vestibulo-ocular reflex (VOR) function (on the side contralateral to the direction of the fast phase of the spontaneous nystagmus);
- Clinical examination criteria for SSNHL: hearing loss of 30 dB or more across at least 3 contiguous frequencies, occurring within ≤ 72 hours with normal hearing on the contralateral ear;
- MRI evaluation of the inner labyrinth based on 3D heavily T2-weighted sequences within 1 month of conducting vestibular and audiometric testing.
The exclusion criteria were: bilateral vestibulocochlear deficits, history of hearing loss and/or ear surgery in the affected ear, acute middle ear inflammation, vestibulocochlear schwannomas or malformations, central neurological symptoms and/or signs, brain lesions like infarct, or intracranial haemorrhage on MRI.
Clinical assessment of inner ear dysfunction
Audiological assessment included:
- pure tone audiometry (PTA) obtained by averaging hearing thresholds in decibel hearing level (dB HL) at 0.5, 1, 2 and 4 kHz via air conduction using headphones (Telephonics TDh4) and via bone conduction, using a bone conductor. Hearing level categories were defined as normal (< 20 dB HL), mild hearing loss (> 20 to ≤ 40 dB HL), moderate hearing loss (> 40 to ≤ 70 dB HL), severe hearing loss (> 70 to ≤ 90 dB HL) and profound hearing loss (> 90 dB HL);
- impedance testing included both tympanometry and acoustic reflex threshold testing.
Vestibular evaluation consisted of:
- bedside examination investigating the presence of spontaneous and/or positional nystagmus, positive head shake test (HST), and clinical head impulse test (HIT);
- instrumental vestibular evaluation by Video HIT (VHIT). The VOR gain value of each canal and the asymmetry value between channel pairs were analysed. VOR gain values of 0.8 and below was considered abnormal, and for the asymmetry between canal pairs, 25% and above were considered abnormal;
- instrumental vestibular evaluation by warm and cold caloric stimulation with video-oculography (VOG) assisted detection of vestibular nystagmus by using the Jongkees’ formula to quantify the asymmetry between the function of the 2 lateral semicircular canals. Values within 14% were considered normal, and results were expressed as unilateral weakness or areflexia.
We established a specific severity score for both audiological and vestibular evaluation according to the clinical severity of inner ear dysfunction.
The audiological score ranging between 0 and 4, on a 5 points scale, was assigned for each side: 0 = normal hearing (< 20 dB HL), 1 = mild (> 20 dB HL to ≤ 40 dB HL), 2 = moderate (> 40 to ≤ 70 dB HL), 3 = severe (> 70 to ≤ 90 dB HL); 4 = profound (> 90 dB HL). Patients were grouped based on their audiological scores into 3 classes of severity: no deficit (class 0), mild-medium deficit (class 1) and severe-profound deficit (class 2).
The vestibular score ranging between 0 and 3, on a 4 points scale, was assigned for each side: 0 = normal vestibular evaluation; 1 = unilateral weakness at the caloric test and/or asymmetric VHIT and/or positive HST; 2 = unilateral areflexia at the caloric test and/or VOR gain reduction at VHIT; 3 = spontaneous nystagmus presence.
The sum of both scores for the pathological side contributed to the cumulative audiovestibular score, with higher scores in severe cases: patients were classified into 2 groups (class 1 and class 2) (Tab. I).
MRI assessment
MRI studies were performed within the first month after the onset of symptoms on a 1.5T scanner (Signa HDxt, GE Healthcare, Milwaukee, Wisconsin, USA). All participants underwent a conventional pre- and post-contrast cerebellopontine angle (CPA) MRI, which included T1, T2, FLAIR, heavily T2-3D Fast Imaging Employing Steady-state Acquisition (FIESTA) and 3D contrast-enhanced T1 imaging.
Heavily T2-3D-FIESTA images were used to segment slice-by-slice the structures of inner ear and the acquisition settings were as follows: time to repetition (TR): 6000 ms; time to echo (TE): 1900 ms; slice thickness: 0.8 mm; slide spacing: 0.4 mm; field of view (FOV): 196 mm x 193 mm x 52 mm; matrix size: 512 x 512; and in-plane pixel size: 0.8 mm.
Two experienced neuroradiologists, who were blinded to the audiovestibular results, analysed the images for each subject.
QUALITATIVE ANALYSIS
A visual assessment was performed by evaluating the changes in signal of the inner ear structures (semicircular canals, cochlea, vestibule) (Cover figure) on the 3D FIESTA and T1 FSE sequences after contrast administration.
The involvement was categorised on 3D FIESTA sequences as follows: score 0, no abnormality; score 1, low signal intensity either in the cochlea or vestibular system; score 2, low signal intensity in both cochlea and vestibular system. The absence or presence of enhancement was classified as either score 0 or score 1 (Fig. 1).
QUANTITATIVE ANALYSIS
The volumetric signal intensity of the entire inner ear, as well as of the vestibular system (semi-circular canals, utricle and saccule) and cochlea separately, were calculated for each side on 3D FIESTA imaging.
The volumetric signal intensity (SI) of each inner ear structure was measured by freehand drawing the volume of interest (VOI) covering the whole target region on each consecutive slice of axial 3D FIESTA imaging; a range of T2 values (T2mean, T2min, and T2Max) was extracted from each target region. T2mean, T2Max, and T2min values reflected the average, highest, and lowest T2 values of each target region, respectively. To eliminate any differences attributed to signal interference, a correction factor was used setting a ROI in the normal white matter of middle cerebellar peduncle of the same patient and the mean signal intensity was measured. The ROI on the reference region was drawn using the ROI tool and was of comparable shape and size (elliptical ROIs of approximately 30-50 mm2) for all patients.
Normalised T2 values (nT2mean, nT2min, and nT2Max) were estimated on both sides as follows (cochlea/ cerebellar peduncle, vestibule/ cerebellar peduncle, vestibulocochlear system/ cerebellar peduncle).
To quantify the difference of the normalised signal intensity values between the affected and non-affected sides, a signal asymmetry ratio was calculated for the cochlea, vestibular system and entire inner ear.
Imaging analysis was carried out using 3D-Slicer software (version 5.0.3, Harvard University, USA), which is an open-source package available on multiple operating systems (Windows, MAC, Linux), built on the NA-MIC Kit (Fig. 1).
Statistical analysis
Descriptive statistics were expressed as the median and interquartile range (IQR) for continuous variables and as numbers and percentages for qualitative variables. Shapiro-Wilk test was used to test the normality of data distribution. The percentage of agreement between auditory impairment and qualitative MRI analysis was calculated.
To examine the predictive significance of signal asymmetry ratio, derived from nT2 volumetric intensity values of internal labyrinthine structures, to differentiate severity classes of cochlear-vestibular deficits, we employed Kruskal-Wallis test and the Mann-Whitney U-test.
Specifically, Kruskal-Wallis test was performed to compare asymmetry ratios of nT2 volumetric intensity values in the cochlea and vestibular system (nT2mean, nT2min, nT2Max asymmetry) among the 3 distinct severity classes of audiological and vestibular impairment, respectively. Post hoc comparisons were conducted using the unpaired Mann-Whitney U-test.
Mann-Whitney U-test was used to compare asymmetry ratios of nT2 volumetric intensity values in the entire internal labyrinth between the 2 severity classes of cumulative cochlear-vestibular deficit. Interobserver variability was evaluated using the intra-class correlation coefficient (ICC) for measuring the quantitative T2w imaging values. Significance was set at p < 0.05.
Receiver operating characteristic (ROC) curve analysis and calculation of the area under the curve (AUC) were employed to establish the optimal cutoff values for asymmetry ratios of nT2 volumetric intensity values in inner ear structures which can differentiate among severity classes of cochlear-vestibular impairment. The AUC values were interpreted as follows: 0.5-0.7= minimal; 0.7-0.9= moderate; > 0.9= high discriminatory power 17,18.
Rank’s correlation coefficient was used to assess the relationship between the asymmetry ratios of nT2 volumetric intensity values of inner labyrinthine structures and the severity classes of cochlear-vestibular impairment.
Statistical analyses were conducted using Statistical Package for the Social Sciences (SPSS) for Windows version 25.0 (SPSS Inc., Chicago, IL, USA). The level of significance was set at p < 0.05, and significance levels were adjusted, according to the Bonferroni correction, for multiple comparisons.
Results
We enrolled 26 patients (17 males and 9 females) with unilateral vestibular and/or auditory dysfunction. The mean age at the time of diagnosis was 47.3 ± 14.7 years, ranging from 27 to 79 years. The patients were followed up for an average period of 8 ± 2 months, with a range of 6 to 12 months.
Audio-vestibular clinical results
All patients showed impaired vestibular and/or audiological function. The side of hearing deficit was on the left in 19 patients and on the right in the remaining 7. Regarding the audiological results, we found that 6 patients (23%) had normal hearing (score 0); the remaining 20 presented a different degree of deafness: 8 mild deafness and 2 moderate (class 1), one severe and 9 profound (class 2) (Tab. I). Vestibular function was normal in 9 subjects (35%) (score 0). Four patients showed incomplete vestibular dysfunction as demonstrated by unilateral weakness assessed by caloric testing and/or asymmetric VOR gain shown by VHIT and/or positive HST (score 1); 3 patients had complete areflexia on caloric testing and/or a significant reduction in VOR gain on VHIT (score 2). Patients with vestibular score 1 and 2 were classified as class 1. Finally, 10 subjects demonstrated an acute vestibular deficit with spontaneous nystagmus (score 3, class 2) (Tab. I). Patients were categorised into 2 classes of cumulative audio-vestibular deficit by grouping audiological and vestibular scores: class 1 included scores 1-3 and class 2 scores 4-7 (Tab. I).
Radiological results
At MRI there were no visible motion artifacts, visible signal abnormalities of the cerebellar peduncle, or abnormalities of the mastoid air cells. In 15 of 26 patients, a low signal-intensity within the inner ear was observed on FIESTA (score 1: 13 patients; score 2: 2 patients). Only 6 patients exhibited enhancement of the labyrinthine structures. The absolute percentage of agreement between the qualitative MRI evaluation and the audio-vestibular impairments on the affected side was low: 45% in patients with auditory impairment, 47% in patients with vestibular impairment and 57.6% in those with combined audio-vestibular dysfunction.
Relationship among MRI quantitative values and clinical classes
We found that only asymmetry ratios of nT2Max and nT2mean volumetric intensity values, extracted from both the cochlea alone and the complete inner ear, displayed significant differences among the 3 severity classes of audiological impairment (nT2Max: p 0.01, nT2mean: p 0.002) and between the 2 severity classes of combined audio-vestibular impairment (nT2Max and nT2mean: p < 0.001) (Tab. II).
Signal intensity asymmetry ratios for nT2mean and nT2Max values extracted from cochlea enabled the discrimination between severity class 2 and both severity classes 0 and 1 of audiological impairment (Tab. III). Furthermore, signal intensity asymmetry ratios for nT2mean and nT2Max values extracted from the inner ear could differentiate severity class 2 from severity class 1 of the overall audio-vestibular impairment (Tab. III).
ROC analysis of asymmetry ratios of nT2-values showed that both nT2Max values and nT2mean values derived from the cochlea and the complete inner ear were useful in distinguishing the most severe class of auditory impairment (class 2) from lower classes and that the diagnostic performance of nT2mean values was excellent (Fig. 2). The optimal cut-off values for nT2mean to distinguish patients with a higher severity of auditory impairment from others were 0.87 for audiological deficit and 0.91 for cochleo-vestibular deficit, respectively (Fig. 2).
A significant correlation was observed between the signal asymmetry ratios for nT2Max and nT2mean values derived from both the cochlea and the entire inner ear, and the severity of hearing impairment (nT2Max and nT2mean vs audiological deficits: p 0.004, r= -0.54; p < 0.001, r= -0.66; nT2Max and nT2mean vs overall audiological-vestibular deficits p < 0.001, r= -0.67; p < 0.001, r= -0.75).
Quantitative analysis of nT2w intensity values showed a good to excellent interobserver reproducibility with an ICCs of 0.76 to 0.99.
Discussion
Unilateral peripheral vestibulocochlear deficits have been poorly studied combining clinical and radiological data. In literature, MRI evaluations were mainly based on visual or semiquantitative methods, where selected ROIs were placed within a representative area of the inner ear 15. These approaches are limited because they may not accurately characterise the overall changes in fluid composition of the inner ear and are susceptible to interobserver variability 10,19-22.
Our analysis showed that the comparison between MRI visual analysis of inner ear structures and hearing impairment had a low rate of agreement, often resulting from a lack of correspondence between the visualisation of the signal changes and auditory disorder. These findings, in accordance with previous studies, limit the reliability of qualitative analysis 12,21-23.
Thus, for each patient we calculated the normalised volumetric threshold values of signal intensity by T2 MR images (nT2min, nT2Max, nT2mean) using unaffected ears as a normal standard for signal intensity ratio calculation. These asymmetry ratios of nT2min, nT2Max, nT2mean were used as quantitative indicators of intralabyrinthic signal changes because signal intensity reflects the composition of endolabyrinthic fluids 9.
Our data demonstrated that among patients with varying degrees of hearing impairment, a significant difference was observed exclusively in the asymmetry ratios of nT2mean and nT2Max intensity values extracted from both the cochlea and the overall inner ear. As clinically demonstrated in a previous personal study on SSNHL without vertigo, involvement of the entire inner ear may be due to a subclinical dysfunction of the vestibular system that is often related to the severity of the cochlear damage 4.
In our series, several clinical classes exhibited low signal intensity ratios, probably revealing an increased protein concentration or labyrinthine haemorrhage 9,14,24 potentially resulting from impairment of the blood-labyrinth barrier of the inner ear and triggered by an acute pathological process which serves as the causative factor of auditory dysfunction 25.
Our data regarding the lack of a significant correspondence between signal intensity values extracted only within the vestibular system and vestibular deficits may be explained by the variations in signal intensity often observed in the vestibule 15. These variations are caused by altered magneto-hydrodynamic Lorentz forces resulting from the highly complex shape of the vestibular system 20,21.
The second goal of our study was to investigate the potential usefulness of the asymmetry ratio value of nT2mean and nT2Max signal intensities, extracted from inner ear structures, to predict the severity of hearing impairment in patients with unilateral audio-vestibular deficit. Patients were categorised into 3 severity classes considering either audiological or vestibular scores and into 2 severity classes considering their overall auditory-vestibular scores. We found that the asymmetry ratios of both nT2mean and nT2Max intensity values accurately differentiated severity class 2 from both severity class 0 and severity class 1 of audiological or vestibular impairment as well as severity class 2 from class 1 of the overall cochleo-vestibular impairment. However, the diagnostic performance of nT2mean values was slightly superior to that of nT2Max values, probably because these values are better capable of capturing the signal changes in the intralabyrinthine fluid composition due to the acute pathological process. The cutoff values of 0.87 and 0.91 for nT2mean values effectively distinguished patients with a higher degree of audiological and overall audio-vestibular impairment, respectively, from others, providing the best balance of sensitivity and specificity.
In conclusion, in patients with unilateral peripheral vestibulocochlear deficits, quantitative MRI values derived from the cochlea and the entire inner ear may reflect changes in the composition of endolabyrinthic fluids caused by a disrupted blood-labyrinthine barrier. The nT2mean and nT2Max values can accurately discriminate patients with a higher degree of hearing impairment and may serve as surrogate non-invasive indicators of hearing impairment severity in patients with unilateral cochleovestibular deficits. The diagnostic performance of nT2mean values is better than nT2Max values and the cut-off values of 0.87 and 0.91 may serve as reliable critical markers of severity, suggesting a poor prognosis.
Although only a few quantitative studies have explored this topic making these results valuable, we are aware of some limitations of our study, including its retrospective design, small sample sizes within the different severity categories of hearing impairment, a brief yet variable time lapse between the onset of cochleovestibular symptoms and the MRI examination, and the absence of a 3D FLAIR sequence for quantitative data comparison in all patients. Thus, multicentric studies, with a larger sample size, as well as more standardised clinical and radiological timeframes are warranted to validate these results. Moreover, although no standardised diagnostic imaging protocol exists for patients with cochleovestibular impairment, a quantitative analysis of the volumetric endolymph/perilymph ratio, along with excessive perilymphatic enhancement evaluated on delayed post-gadolinium 3D-FLAIR inner ear imaging, might provide additional diagnostic value. This could overcome the limitations of high-resolution T2-weighted sequences, which cannot distinguish between the endolymphatic and perilymphatic compartments as they both return high signals. Additionally, since auditory devices have become MRI-compatible, using the metal artifact reduction algorithm 26,27 presents a challenge in improving diagnostic quality in the follow-up of patients eligible for cochlear implants.
Conclusions
Quantitative analysis of MRI can be considered a valid aid in the diagnosis and identification of the severity of hearing deficits. In particular, the asymmetry ratios of the nT2mean and nT2Max signal intensity values derived from the cochlea and the entire internal labyrinth can be considered as reliable indicators of unilateral cochlear-vestibular deficits and could have potential prognostic value. Therefore, in patients with unilateral peripheral vestibulocochlear deficit, it is recommended to evaluate the quantitative values of the MRI of the inner ear which theoretically reflect changes in the composition of the endolabyrinthine fluids related to interruption of the blood-labyrinthine barrier.
Conflict of interest statement
The authors declare no conflict of interest.
Funding
This research did not receive any specific grant from funding agencies in the public, commercial, or no-profit sectors.
Author contributions
RC, PMP: designed and coordinated the study, participated in data acquisition and analysis, interpreted the data and drafted the manuscript; FP, GR: participated in data interpretation and statistical analysis; MP, GM: interpreted data and revised the manuscript; SG, JG: revised the manuscript; AT, DR: participated in data interpretation and revision of the manuscript.
The authors made substantial contributions to the study.
Ethical consideration
The present study (ID 5553) was reviewed and approved (28/03/2023) by the Ethical Committee of Fondazione Policlinico Universitario A. Gemelli IRCCS (approval number 0010278/23) and the study was carried out in accordance with the Declaration of Helsinki. The research was conducted ethically, with all study procedures being performed in accordance with the requirements of the World Medical Association’s Declaration of Helsinki. Written informed consent was obtained from each participant/patient for study participation and data publication.
History
Received: March 22, 2024
Accepted: October 14, 2024
Figures and tables
Figure 1. Schematic representation of inner ear structures and T2 intensity values in a patient with unilateral audio-vestibular deficit. Axial view 3D-FIESTA (A-D). Volumes of cochlea (red shaded area in A-B), vestibular system including semicircular canals, utricle and saccule (blue shaded area in a-b) and whole inner ear (yellow shaded area in C-D) were generated on each consecutive axial slice of 3D-T2-weighted (T2W) images. The signal intensity (SI) of the corresponding labyrinthine structures were measured on 3D-T2WI and a range of T2 intensity values (T2mean, T2Max, and T2min) were extracted, reflecting the average, highest, and lowest T2 intensity values of the cochlea, vestibular system and whole inner ear, respectively. To normalise T2 signal intensity values, a ROI (green shaded area) was identified in the normal white matter of middle cerebellar peduncle of the same patient and the mean signal intensity was measured.
Figure 2. Boxplots and receiver operator curves (ROC) analysis for asymmetry ratios of normalised minimum (nT2mean) and maximum (nT2Max) signal intensity values extracted from cochlea (A-B) and inner ear (C-D) by T2-weighted images. nT2Max and nT2mean intensity values were lower in class with the higher hearing deficit (class 2 of audiological and audio-vestibular impairments) than other classes (classes 0-1 of audiological impairment and class 1 of audio-vestibular impairment). The range and distribution of the nT2 values signal intensity ratio were visualised using box plots. On each box, the dark horizontal line is the median value, and the edges of the box are interquartile range. The area under curve (AUC) of nT2 values showed that both nT2mean and nT2Max values were accurate in distinguishing class 2 from lower classes. However, the diagnostic performance of nT2Max values was moderate (class 2 vs classes 1-0 of audiological impairment: AUCnT2Max= 0.85, 95% CI= 0.71-1.003; class 2 vs class 1 of audio-vestibular impairment: AUCnT2Max= 0.90, 95% CI= 0.77-1.03) while the diagnostic performance of nT2mean values was excellent (class 2 vs classes 1-0 of audiological impairment: AUCnT2mean= 0.92, 95% CI= 0.80-1.03; class 2 vs class 1 of combined audio-vestibular impairment: AUCnT2mean= 0.94, 95% CI= 0.84-1.04).
| Audiological severity scores; n. pts | Audiological severity categories; n. pts |
| Score 0: normal (< 20 dB HL); n. 6 pts | Class 0 (score 0); n. 6 pts |
| Score 1: mild (> 20 to ≤ 40 dB HL); n. 8 pts | Class 1 (scores 1-2); n. 10 pts |
| Score 2: moderate (> 40 to ≤ 70 dB HL); n. 2 pts | Class 2 (scores 3-4); n. 10 pts |
| Score 3: severe (> 70 to ≤ 90 dB HL); n. 1 pts | |
| Score 4: profound (> 90 dB HL): n. 9 pts | |
| Vestibular severity scores; n. pts | Vestibular severity categories; n. pts |
| Score 0: normal; n. 9 pts | Class 0 (score 0); n. 9 pts |
| Score 1: unilateral weakness at the caloric test and/or asymmetric VHIT and/or positive HST; n. 4 pts | Class 1 (scores 1-2); n. 7 pts |
| Score 2: unilateral areflexia at the caloric test and/or VOR gain reduction at VHIT; n. 3 pts | Class 2 (scores 3); n. 10 pts |
| Score 3: spontaneous nystagmus presence; n. 10 pts | |
| Cumulative audio-vestibular score | Audio-vestibular severity categories; n. pts |
| Scores 1-7: sum of audiological and vestibular scores | Class 1 (scores 1-3); n. 16 pts |
| Class 2 (scores 4-7); n. 10 pts | |
| n: number; pts: patients. | |
| Audiological severity classes | p value | |
| (classes 0-1-2) | ||
| nT2min asymmetry ratio (cochlea)Median [IQR] | 0.73 [IQR 0.4.-1.80] | 0.37 |
| nT2Max asymmetry ratio (cochlea)Median [IQR] | 0.97 [IQR 0.88-1.05] | 0.01 |
| nT2mean asymmetry ratio (cochlea)Median [IQR] | 0.94 [IQR 0.82-0.99] | 0.002 |
| Vestibular severity classes | p value | |
| (Classes 0-1-2) | ||
| nT2min asymmetry ratio (vestibular system)Median [IQR] | 0.99 [IQR 0.71-1.7] | 0.27 |
| nT2max asymmetry ratio (vestibular system)Median [IQR] | 0.97 [IQR 0.86-1.02] | 0.95 |
| nT2mean asymmetry ratio (vestibular system)Median [IQR] | 0.99 [IQR 0. 86-1.06] | 0.72 |
| Audio-vestibular severity classes | p value | |
| (Classes 1-2) | ||
| nT2 min asymmetry ratio (inner ear)Median [IQR] | 0.91 [IQR 0.70-2] | 0.58 |
| nT2Max asymmetry ratio (inner ear)Median [IQR] | 0.96 [IQR 0.86-1.02] | < 0.001 |
| nT2mean asymmetry ratio (inner ear)Median [IQR] | 0.95 [IQR 0.81-1.01] | < 0.001 |
| nT2min: normalised minimum signal intensity value on T2-weighted images; nT2Max: normalised maximum signal intensity value on T2-weighted images; nT2mean: normalised mean signal intensity value on T2-weighted images. | ||
| Signal asymmetry ratio Median [IQR] | Audiological severity class 0 | Audiological severity class 1 | Audiological severity class 2 | p value (classes 0-1) | p value (classes 1-2) | p value (classes 0-2) | |
| nT2Max (cochlea) | 1.03 [IQR 0.95-1.05] | 1.02 [IQR 0.93-1.11] | 0.85 [IQR 0.75-0.95] | 0.96 | 0.009 | 0.011 | |
| nT2mean (cochlea) | 0.99 [IQR 0.94-1.09] | 0.96 [IQR 0.93-1.004] | 0.74 [IQR 0.41-0.85] | 0.71 | 0.001 | 0.003 | |
| Signal asymmetry ratio Median [IQR] | Audio-vestibular severity class 1 | Audio-vestibular severity class 2 | p value (classes 1-2) | ||||
| nT2Max (inner ear) | 0.98 [IQR 0.97–1.04] | 0.82 [IQR 0.72.–0.93] | < 0.001 | ||||
| nT2mean (inner ear) | 0.99 [IQR 0.96–1.07] | 0.79 [IQR 0.43.–0.86] | <0.001 | ||||
| nT2Max: normalised maximum signal intensity value on T2-weighted images; nT2mean: normalised mean signal intensity value on T2-weighted images. | |||||||
| Only significant values of quantitative measures shown in Tab. III were used to differentiate clinical severity classes. | |||||||
References
- Mattox D, Simmons F. Natural history of sudden sensorineural hearing loss. Ann Otol Rhinol Laryngol. 1997;86:463-480. doi:https://doi.org/10.1177/000348947708600406
- Picciotti P, Anzivino R, Galli J. Clinical evolution of acute vestibular syndrome: longitudinal retrospective analysis of epidemiological data and prognostic factors for recovery. Pers Med. 2023;13. doi:https://doi.org/10.3390/jpm13030407
- Strupp M, Bisdorff A, Furman J. Acute unilateral vestibulopathy/vestibular neuritis: diagnostic criteria. J Vestib Res Equilib Orientat. 2022;32:389-406. doi:https://doi.org/10.3233/VES-220201
- Quaranta N, Longo G, Dadduzio S. Ocular and cervical vestibular-evoked myogenic potentials in idiopathic sudden sensorineural hearing loss (ISSHL) without vertigo: VEMPs in ISSHL. Eur Arch Otorhinolaryngol. 2022;277:409-414. doi:https://doi.org/10.1007/s00405-019-05724-x
- Kuhn M, Heman-Ackah S, Shaikh J. Sudden sensorineural hearing loss: a review of diagnosis, treatment, and prognosis. Trends Amplif. 2011;15:91-105. doi:https://doi.org/10.1177/1084713811408349
- Pogson J, Taylor R, Young A. Vertigo with sudden hearing loss: audio-vestibular characteristics. J Neurol. 2016;263:2086-2096. doi:https://doi.org/10.1007/s00415-016-8214-0
- Stachler R, Chandrasekhar S, Archer S. Clinical practice guideline: sudden hearing loss. Otolaryngol Head Neck Surg. 2012;146:S1-S35. doi:https://doi.org/10.1177/0194599812436449
- Yang C-J, Yoshida T, Sugimoto S. Lesion-specific prognosis by magnetic resonance imaging in sudden sensorineural hearing loss. Acta Otolaryngol (Stockh). 2021;141:5-9. doi:https://doi.org/10.1080/00016489.2020.1827159
- Yoshida T, Sugiura M, Naganawa S. Three-dimensional fluid-attenuated inversion recovery magnetic resonance imaging findings and prognosis in sudden sensorineural hearing loss. Laryngoscope. 2008;118:1433-1437. doi:https://doi.org/10.1097/MLG.0b013e318172ef85
- Veillon F, Riehm S, Eliezer M. Present and future of the labyrinth imaging: focus on the use of T2-weighted and contrast-enhanced delayed FLAIR (1 h) sequences. J Vestib Res Equilib Orientat. 2021;31:251-259. doi:https://doi.org/10.3233/VES-200796
- Benson J, Carlson M, Lane J. MRI of the internal auditory canal, labyrinth, and middle ear: how we do it. Radiology. 2020;297:252-265. doi:https://doi.org/10.1148/radiol.2020201767
- Conte G, Di Berardino F, Sina C. MR imaging in sudden sensorineural hearing loss. Time to talk. AJNR Am J Neuroradiol. 2017;38:1475-1479. doi:https://doi.org/10.3174/ajnr.A5230
- Wang J, Ren T, Sun W. Post-contrast 3D-FLAIR in idiopathic sudden sensorineural hearing loss. Eur Arch Otorhinolaryngol. 2019;276:1291-1299. doi:https://doi.org/10.1007/s00405-019-05285-z
- Berrettini S, Seccia V, Fortunato S. Analysis of the 3-dimensional fluid-attenuated inversion-recovery (3D-FLAIR) sequence in idiopathic sudden sensorineural hearing loss. JAMA Otolaryngol Head Neck Surg. 2013;139:456-464. doi:https://doi.org/10.1001/jamaoto.2013.2659
- Compagnone L, Levigne V, Pereira B. Injected 3T-3D-FLAIR-MRI labyrinthine patterns match with the severity and tonotopic alteration in sudden sensorineural hearing loss. Eur Arch Otorhinolaryngol. 2022;279:4883-4891. doi:https://doi.org/10.1007/s00405-022-07328-4
- Venkatasamy A, Huynh T, Wohlhuter N. Superior vestibular neuritis: improved detection using FLAIR sequence with delayed enhancement (1 h). Eur Arch Otorhinolaryngol. 2019;276:3309-3316. doi:https://doi.org/10.1007/s00405-019-05639-7
- Hanley J, McNeil B. The meaning and use of the area under a receiver operating characteristic (ROC) curve. Radiology. 1982;143:29-36. doi:https://doi.org/10.1148/radiology.143.1.7063747
- Swets J. Measuring the accuracy of diagnostic systems. Science. 1988;240:1285-1293. doi:https://doi.org/10.1126/science.3287615
- Oehler M, Schmalbrock P, Chakeres D. Magnetic susceptibility artifacts on high-resolution MR of the temporal bone. AJNR Am J Neuroradiol. 1995;16:1135-1143.
- Lane J, Ward H, Witte R. 3-T imaging of the cochlear nerve and labyrinth in cochlear-implant candidates: 3D fast recovery fast spin-echo versus 3D constructive interference in the steady state techniques. AJNR Am J Neuroradiol. 2004;25:618-622.
- Ward B, Mair A, Nagururu N. Correlation between histopathology and signal loss on spin-echo T2-weighted MR images of the inner ear: distinguishing artifacts from anatomy. AJNR Am J Neuroradiol. 2022;43:1464-1469. doi:https://doi.org/10.3174/ajnr.A7625
- Inui H, Sakamoto T, Ito T. Magnetic resonance imaging of endolymphatic space in patients with sensorineural hearing loss: comparison between fluctuating and idiopathic sudden sensorineural hearing loss. Acta Otolaryngol (Stockh). 2020;140:345-350. doi:https://doi.org/10.1080/00016489.2020.1720919
- Song C, Pogson J, Andresen N. MRI with gadolinium as a measure of blood-labyrinth barrier integrity in patients with inner ear symptoms: a scoping review. Front Neurol. 2021;12. doi:https://doi.org/10.3389/fneur.2021.662264
- Conte G, Di Berardino F, Mastrapasqua R. Prognostic value of early magnetic resonance imaging patterns in sudden hearing loss. Audiol Neurootol. 2022;27:64-74. doi:https://doi.org/10.1159/000515153
- Liao W-H, Wu H-M, Wu H-Y. Revisiting the relationship of three-dimensional fluid attenuation inversion recovery imaging and hearing outcomes in adults with idiopathic unilateral sudden sensorineural hearing loss. Eur J Radiol. 2016;85:2188-2194. doi:https://doi.org/10.1016/j.ejrad.2016.10.005
- Canzi P, Carlotto E, Simoncelli A. The usefulness of the O-MAR algorithm in MRI skull base assessment to manage cochlear implant-related artifacts. Acta Otorhinolaryngol Ital. 2023;43:273-282. doi:https://doi.org/10.14639/0392-100X-N2434
- Canzi P, Carlotto E, Simoncelli A. Recent advances in managing mri artifacts caused by auditory implants: the effect of metal artifact reduction sequences. Audiologia e Foniatria. 2022;7:25-33. doi:https://doi.org/10.14658/pupj-IJAP-2022-1-4
Downloads
License

This work is licensed under a Creative Commons Attribution-NonCommercial-NoDerivatives 4.0 International License.
Copyright
Copyright (c) 2025 Società Italiana di Otorinolaringoiatria e chirurgia cervico facciale
How to Cite
- Abstract viewed - 1287 times
- PDF downloaded - 173 times