


Audiology
Vol. 46: Issue 4 - August 2026
The effect of hearing loss above 2 kHz on temporal resolution and speech understanding in noise
Authors
Büşra Gökçe
 , Rabia Aygün
, Zahra Polat
, Rabia Aygün
, Zahra Polat
Summary
Cover Image
Objective. This study aimed to evaluate temporal resolution, speech understanding in noise, and daily communication difficulties in individuals with sensorineural hearing loss above 2 kHz.
Method. Thirty adults aged 38-59 years with high-frequency sensorineural hearing loss (HF-SNHL) were included as the study group, and 30 individuals aged 37-59 years with normal hearing as the control group. Participants completed the Gap Detection, Random Gap Detection, Turkish Matrix Test (TMT), and the Speech, Spatial Perception, and Hearing Quality (SSQ) scale. Statistical comparisons and decision-tree analyses were conducted.
Results. Significant differences between groups were observed in temporal resolution tests, speech recognition thresholds (SRT), and speech intelligibility percentages in -5 dB signal to noise ratio condition of the TMT, as well as in SSQ results. Decision-tree analysis indicated that the Speech Perception subscale of the SSQ and the TMT SRT in noise procedure were considered useful for identifying HF-SNHL.
Conclusions. Temporal resolution was found to be reduced, and speech comprehension in noise impaired in individuals with HF-SNHL. The SSQ played a decisive role in identifying individuals with HF-SNHL.
Introduction
Sensorineural hearing loss (SNHL) usually begins with high frequencies and may progress to lower frequencies. High-frequency hearing loss may result from age, noise exposure, chemicals, vascular and metabolic disorders, ototoxic drugs, tumours, or genetic factors. A study reported that high-frequency hearing loss (3, 4, 6 kHz) was more prevalent than speech-frequency hearing loss (0.5, 1, 2, 4 kHz) 1, indicating greater impact of high-frequency loss.
Temporal resolution in the auditory system is the ability to distinguish very short-term changes between sound stimuli and reflects auditory processing processes at both the peripheral and central levels. At the peripheral level, this ability is primarily related to rapid neural coding processes occurring in the cochlea (particularly at the level of inner hair cells and auditory nerve fibres). Hair cells in the cochlea transmit the temporal characteristics of sound waves to auditory nerve fibres via phase locking. The sensitivity of the firing timing of auditory nerve fibres forms the neurophysiological basis for distinguishing minimal silence intervals (gaps) between 2 sounds. At the central level, temporal resolution is shaped at higher processing stages (e.g., cochlear nucleus, superior olivary complex, inferior colliculus, and auditory cortex) and through synchronisation mechanisms. Processing at this level is critical for speech intelligibility and auditory figure-ground discrimination in complex listening environments 2.
In addition to peripheral damage, individuals with high-frequency SNHL may have impaired stimulus transmission and processing in the central auditory system. Studies report decreased temporal resolution in HF-SNHL 3,4 and aging 5. Guinea pigs with normal low-frequency hearing but HF-SNHL showed reduced temporal resolution after noise exposure 6.
Understanding sound requires analysis of spectral and temporal information. One study preserved temporal and amplitude cues while partially removing spectral detail, showing high accuracy in vowel, consonant, and sentence recognition, emphasising the importance of temporal cues 7. Therefore, evaluating hearing loss together with temporal features is crucial. Speech recognition issues are also common in SNHL. Reduced auditory input affects language skills, phonological awareness 8, and impairs verbal communication. Background noise, often present in daily life, exacerbates this issue. SNHL patients struggle with speech-in-noise and consonant recognition 9, which relies on high-frequency cues. The fricative /s/ (and affricative /z/) are frequent phonemes in English 10, and essential for linguistic markers. Perception of these phonemes requires hearing above 4 kHz 11. Speech energy is concentrated below 1 kHz and reduced above 2 kHz 12. Sentence-based speech tests, reflecting daily speech, reveal lower comprehension in individuals with hearing loss. Evaluating speech recognition in noise is essential to determine the need for rehabilitation. Assistive device decisions are difficult in patients with HF-SNHL, where hearing aid candidacy is borderline, yet amplification has proven beneficial above 2 kHz 13.
Temporal resolution may decrease with age and hearing loss 14. Cesur and Derinsu found that temporal resolution decreases with age in a study involving young adults with normal hearing and older adults with normal hearing 5. Kim et al. included young adults with normal hearing and individuals aged 60 years and older in their study. They demonstrated a significant decrease in speech perception performance in noisy environments with age 15. These results reveal the importance of considering the effect of age when evaluating speech comprehension in HF-SNHL.
Decision making is important in medical situations. The decision tree is one of the widely used machine learning models in a wide range of medical situations that require decision making, providing high classification accuracy with a simple representation of the collected information 16. Compared to other machine learning models, the decision tree has some advantages. It provides a transparent decision-making process. Therefore, it can be easily validated by an expert. It is also visualisable and easy to understand and interpret in clinical practice. It is important to use new approaches in processing the information obtained. In decision-making situations, it is important to add alternative methods in addition to traditional methods to make the appropriate decisions.
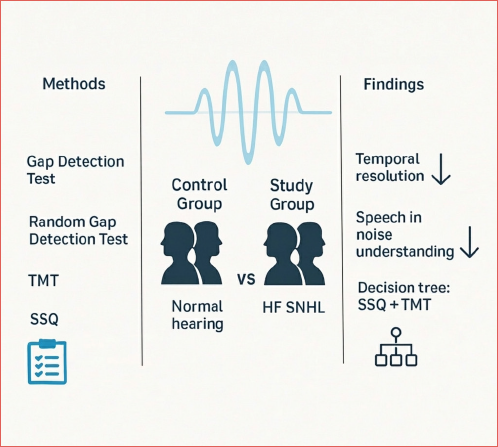
Our study aims to examine the difficulties caused by hearing loss at high frequencies in a detailed way even if hearing at low frequencies is within normal limits. In this context, our cross-sectional and analytically designed study aimed to evaluate temporal resolution, a component of auditory processing, in individuals under 60 years of age with HF-SNHL who had hearing thresholds exceeding 20 dB HL at high frequencies above 2 kHz. At the same time, we thought that the difficulties experienced by individuals in noisy environments, which they frequently encounter in daily life, should be revealed. We also aimed to emphasise the importance of comprehensive assessments to identify the need for referral to assistive practices. For these purposes, we used temporal resolution tests, a speech comprehension in noise test, and a self-assessment scale to identify subjective complaints. At the same time, we aimed to include decision tree calculations while analysing the data obtained in our study to reveal which evaluation methods are more decisive for diagnosis. A visual summary of the evaluation process and study design is presented in the Cover figure.
Materials and methods
This study was conducted at Istanbul University-Cerrahpaşa Medical Faculty Audiology, Language and Speech Disorders Unit.
Participants
The study group consisted of 30 individuals aged 38-59 years with HF-SNHL with hearing thresholds greater than 20 dB after 2 kHz, while the control group consisted of 30 individuals aged 37-59 years with normal hearing. To minimise the effects of age, the upper age limit for both groups was set at 59 years. Participants whose native language is Turkish were included in the study to avoid confounding factors. Individuals with middle ear problems, those whose native language is not Turkish, and those who scored 21 points or less on the Montreal Cognitive Assessment (MoCA) test were not included in the study. Individuals with pure-tone thresholds above 20 dB HL at high frequencies after 2000 Hz for at least 6 months were included in the study group.
The study group with bilateral hearing loss had less than 10 dB difference between their right and left ear thresholds and were unable to use hearing aids. They had normal otoscopic and immittance findings. There were no reported health problems in their medical history, such as middle ear problems, learning difficulties, speech, and language disorders, etc.
Procedure
A comprehensive audiologic evaluation was performed after obtaining information about the adults in the study and control groups through a questionnaire. The “Informed Consent Form” was read and signed by all participants. All adults included in the study underwent otoscopic and tympanometry examinations. Audiometric evaluations were performed with a GSI Audiostar Pro (Grason-Stadler Inc. Tiger/USA) audiometer in a sound-treated booth complying with Natus Medical Inc. (Denmark) standards. Pure tone thresholds and speech audiometry tests were performed during the evaluation. Air conduction evaluations were performed in the frequency range of 125-8000 Hz and bone conduction evaluations were performed in the frequency range of 500-4000 Hz. In addition, the Gap Detection Test (GDT), Random Gap Detection Test (RGDT), Turkish Matrix Test (TMT), and Speech, Spatial Perception, and Hearing Quality Scale (SSQ) were also applied for comprehensive audiological evaluation.
GAP DETECTION TEST
The adaptive GDT was conducted using MATLAB R2016a (The MathWorks, Natick, MA) 17. For optimal sound quality, a Focusrite Scarlett Solo 2i2 sound card (24-bit resolution; 44.1 kHz sampling rate) and E-A-RTONE-3A (Aearo Company) insert headphones were used. PsyAcoustXGUI software ensured that stimulus timing was independent of CPU speed, which is critical for msec-level auditory stimuli.
In this study, symmetrical HF-SNHL and normal-hearing individuals were tested bilaterally at 40 dB sound level (SL) above their pure tone averages. Of 3 broadband noises (100-8000 Hz, 500 msec duration), one had a temporal gap. After a training trial, participants identified the stimulus with the gap. Two correct responses decreased the gap; one incorrect response increased it, enabling threshold determination.
RANDOM GAP DETECTION TEST
RGDT uses 0.5, 1, 2, and 4 kHz pure tones, with inter-stimulus intervals randomly ranging from 0-40 msec. A practice trial with 1000 Hz tones in ascending order preceded the main test. The test was performed bilaterally via insert earphones at 40 dB SL above pure tone averages, with randomly varying gaps between tonal pairs at 500, 1000, 2000, and 4000 Hz. Participants indicated whether they heard one or 2 sounds. Thresholds were calculated for each frequency, and a composite RGDT value was obtained by averaging all thresholds.
TURKISH MATRIX TEST
TMT was administered via the Oldenburg Measurement Application with Aurical Aud (GN Otometrics, Denmark), using JBL Control One speakers in quiet booths. In the adaptive procedure, the speech recognition threshold (SRT) in noise and corresponding signal to noise ratio (SNR) were calculated. Noise was set at 65 dB SPL; speech stimulus level was adjusted. Starting at 0 dB SPL, the level decreased if 3 of 5 words were correct; otherwise, it increased. This determined the SNR for 50% word recognition.
In the non-adaptive procedure, speech intelligibility (SI) was measured at fixed SNR of -5 dB. Speech level was adjusted to 40 dB SL above pure tone averages; noise was set accordingly. SI was calculated based on correct word recognition. Stimuli were presented at 0° azimuth (S0N0).
SPEECH, SPATIAL PERCEPTION, AND HEARING QUALITIES SCALE
The SSQ assesses speech understanding and hearing quality in adults. We used its Turkish version. The scale consists of 49 items in 3 subscales: “Speech Perception” (complex sounds), “Spatial Perception” (sound localisation), and “Qualities of Hearing” (subjective quality). Scores range from 0 to 10. Subscale scores were calculated by averaging item responses. The overall SSQ score was the average of all item scores 18.
Statistical analysis
IBM SPSS v25 (SPSS Inc., Chicago, USA) was used for statistical analysis. Normality was assessed using the Shapiro-Wilk test, and homogeneity of variances using Levene’s test. Both visual (histograms, Q-Q plots) and analytical methods (Student’s t-test, Pearson correlation) were used to analyse the data. Descriptive statistics were reported as mean ± standard deviation (SD). Significance was set at p < 0.05. Correlation levels are classified as weak between 0 and 0.4; moderate between 0.4 and 0.59; high between 0.60 and 0.84; and very high between 0.85 and 1. Decision tree analysis used the CHAID algorithm, dividing data into subgroups. Categories were combined and compared using chi-square (χ2) tests, forming a hierarchical tree. Splits were based on significance levels, enabling identification of variables related to the dependent outcomes. Normality of distributions was confirmed for all variables in both groups using the Shapiro-Wilk test (p > 0.05). Homogeneity of variances for age and gender was verified with the Levene test (p > 0.05). Independent-samples t-tests were used for group comparisons. To determine the adequacy of the sample size, a previous study with similar methodology was referenced 19. Based on a large effect size (Cohen’s d = 0.80), an a priori power analysis (α = 0.05, two-tailed; 1-β = 0.80) indicated a minimum of 25 participants per group for the independent-samples t-test. Since this study included 30 participants in each group, the achieved statistical power exceeded 0.90 for large effects.
Results
The study included 60 adults (30 with HF-SNHL and 30 with normal hearing). The mean age of the HF-SNHL group was 51.2 ± 6.2 years, and that of the control group was 47.9 ± 7.9 years; the difference was not significant (p = 0.164). The groups were homogeneous in terms of age and gender (p > 0.05). There was no significant difference between the groups in terms of age (p = 0.08) and gender (p = 0.8). The mean pure tone thresholds for both groups are shown in Figure 1. Normal distribution and equal variances were also confirmed for all audiometric variables (Shapiro-Wilk and Levene tests, p > 0.05). Independent-samples t-tests showed no significant difference for the groups in hearing thresholds at 2 kHz and lower frequencies (p > 0.05). Additionally, no significant difference was observed in the average pure tone thresholds of the right and left ears of the study group at each frequency (p > 0.05). The hearing losses in the study group were bilateral and symmetrical. No significant differences were observed between the average hearing thresholds at 4000 Hz, 6000 Hz, and 8000 Hz between the right and left ears (p = 0.88, p = 0.83, p = 0.84).
Comparison of Temporal Resolution Test results
An independent samples t-test was used for intergroup comparisons in the GDT assessment. The Shapiro-Wilk test showed that the normality assumption was met in both groups (study, p = 0.057; control, p = 0.061). According to the Levene test, the variances were not equal (p = 0.016). Therefore, the groups were compared using the Welch test, which does not assume homogeneity of variance. Evaluations were performed using the Independent Samples T Test. A significant difference (p < 0.05) was found between the study group and the control group in the GDT results. The effect size indicating group difference was moderate (d = 0.74) (Tab. I).
For the RGDT, normality was confirmed for the 500, 1000, 2000, and 4000 Hz thresholds and for the composite score in both groups (Shapiro-Wilk, p > 0.05). The Levene test showed equal variances for some variables (500 Hz, p = 0.052; 1000 Hz, p = 0.065) and unequal variances for others (2000 Hz, p = 0.031; 4000 Hz, p < 0.05; composite, p < 0.05). Therefore, the groups were compared using the Welch t-test. Statistically significant differences (p < 0.05) were found between the groups at 500, 1000, 2000, and 4000 Hz RGDT and in composite RGDT values (Tab. I). The effect size was moderate at 500 Hz (d = 0.72), 1000 Hz (d = 0.69), and 2000 Hz (d = 0.72), while it was large at 4000 Hz (d = 0.84). For the composite RGDT, the effect size was moderate-to-large (d = 0.78), indicating a meaningful practical difference.
Comparison of Turkish Matrix Test results
Normality of distributions was verified with the Shapiro-Wilk test, and homogeneity of variances with the Levene test. The distribution of the SRT variable was normal for both groups (control, p = 0.280, study, p = 0.370), but variances were unequal (Levene test, p = 0.019). Therefore, the Welch-corrected t-test was used for SRT. Evaluations were performed using the independent samples T test. Statistically significant higher values were obtained in the study group compared to the control group in SRT values in adaptive noise (p < 0.05), and the difference corresponded to a large effect size (d = 1.67) (Tab. II). This result indicates that the control group’s SRT values were significantly higher than those of the study group. For the -5 dB SNR SI variable, both groups showed normal distributions (control, p = 0.870; study, p = 0.811), but the assumption of equal variances was again violated (Levene test, p < 0.05). Therefore, Welch’s t-test was applied. Significantly lower scores were found in -5 SNR SI percentages, compared to the control group (p < 0.05), and this difference also demonstrated a large effect size (d = 2.37) (Tab. II). Accordingly, speech intelligibility scores of the control group were significantly higher than those of the study group.
Comparison of the results of the SSQ Scale
Distributions were normal in both groups for all SSQ variables (Shapiro-Wilk, p > 0.05). Variances were unequal for the Speech Perception, Quality of Hearing, and overall mean variables (p < 0.05), but homogeneous for the Spatial Perception variable (p = 0.055). Independent-samples t-tests and Welch corrections were used where appropriate.
A statistically significant difference was observed between the groups in Speech Perception, Spatial Perception, Quality of Hearing, and overall mean scores (p < 0.05). Cohen’s d coefficients indicated large effect sizes across all subscales, confirming the practical significance of these differences (Tab. III).
Correlation analysis
Before performing correlation analyses across all participants, data normality was evaluated using the Shapiro-Wilk test. GDT (p < 0.05) and SRT (p < 0.05) did not meet the normality assumption whereas RGDT (p = 0.052), -5 SNR SI (p = 0.057), SSQ overall mean (p = 0.073), HF threshold averages (p = 0.054), and SSQ Speech Perception (p = 0.059) satisfied it. Therefore, logarithmic, square root, and Box-Cox transformations were tested; the Box-Cox transformation was selected as the most appropriate method. After transformation, normality was achieved in the GDT and SRT variables (p > 0.05). The Pearson Correlation Test was applied.
The correlation results of the HF threshold averages at 4, 6, and 8 kHz of the study group and the other tests applied are shown in Table IV. A significant, positive, and weak correlation was observed between HF threshold averages and GDT and RGDT (30%). Furthermore, HF threshold averages were positively and highly correlated with SRT (74%), negatively and highly (84%) correlated with SI at -5 SNR, negatively and highly (60%) correlated with the mean SSQ score, and negatively and highly (62%) correlated with the Speech Perception subscale of the SSQ.
A significant, positive, and weak correlation was observed between GDT and RGDT assessing temporal resolution (34%). GDT was positively correlated with adaptive noise SRT (40%) and negatively, correlated with non-adaptive noise -5 SNR SI (40%) and Speech Perception subscale of SSQ (28%). No significant correlation was observed between GDT and average SSQ score (p > 0.05).
In adaptive noise, no significant correlation was observed between RGDT and SRT and -5 SNR SI, whereas a significant, negative, and weak correlation was observed between RGDT and mean SSQ score (36%) and Speech Perception subscale (33%). SRT was significantly, negatively, and moderately correlated with the mean SSQ score (46%) and the Speech Perception subscale of the SSQ (48%). Also, a significant, positive, and moderate correlation was observed between non-adaptive -5 SNR SI and average SSQ score (54%) and Speech Perception subscale of SSQ (54%).
Decision tree
The CHAID algorithm was applied to explore multivariate relationships among variables using chi-square (χ2) partitioning. The 10-fold cross-validation method was used to assess model generalisability. In this approach, data were divided into 10 subsets, and the model was iteratively trained and tested on each, reducing potential bias and improving external validity.
The SSQ Speech Perception variable was placed at the root node in the decision tree analysis; participants with ≤ 7.14 were assigned to the study group, and those with Speech Perception > 7.14 were assigned to the control group (χ2(1, n = 60) = 40.00, p < 0.001). According to this criterion, 24 of the 30 patients were classified as the study group, and 6 were classified as the normal group.
In the next split, individuals with SNR > -4 dB were assigned to the study group (n = 5), and those with SNR ≤ -4 dB to the control group (n = 1) (χ2(1, n = 36) = 29.03, p < 0.001). The final classification performance of the model was found to be accuracy = 93.3%, sensitivity = 86.7%, and specificity = 100%. Cross-validation results showed that the model’s generalisable performance was at the level of accuracy = 81.7%, sensitivity = 96.7%, and specificity = 66.7%. These results indicate that the model achieved strong sensitivity but reduced specificity, likely due to the limited sample size.
Discussion
SNHL is one of the most common types of hearing loss and usually starts in the higher frequencies and expands to the lower frequencies over time. In addition to the damage to the peripheral system, impairments in the central auditory system can also be seen due to SNHL. Therefore, individual differences observed in temporal resolution should be considered as a combination of both peripheral and central contributions.
A decrease in hearing sensitivity at the peripheral level and neuronal impairment at the central level may explain the deterioration in temporal processing performance 3,4,6. Consequently, the assessment of temporal resolution provides a valuable indicator of the holistic functioning of the auditory system. Speech has a wide frequency range, but the spectrum energy is higher at frequencies below 1 kHz and lower at frequencies above 2 kHz. For this reason, the difficulties experienced by individuals with high-frequency hearing loss with normal hearing limits at low frequencies should be examined in detail. It was aimed to evaluate temporal resolution to reveal the difficulties caused by the noise that is frequently exposed in daily life, to assess the subjective complaints of these individuals, and to investigate the relationships between the tests in our study.
Temporal resolution may be affected in hearing losses involving high frequencies. Studies have shown that temporal resolution decreases with HF-SNHL 4,14. Hoover, Pasquesi, and Souza, in a study of young adults with normal hearing and older adults with mild to moderate HF-SNHL, found a significant difference in temporal resolution between the 2 groups 14. However, in a study by Matos and Frota, individuals with normal hearing and individuals with mild to moderate SNHL were examined with the Gaps in Noise (GIN) test and no significant difference was found between the normal hearing and hearing loss groups 20. Supporting Hoover, Pasquesi, and Souza, temporal resolution was observed to decrease with high-frequency sensorineural hearing loss in our study 14. A significant difference (p < 0.05) was found between our study and control groups in the GDT results and RGDT values (Tab. I). In addition, higher thresholds were observed at low frequencies in RGDT, where frequency-specific evaluations can be made, following previous studies 21.
Hearing loss experienced at high frequencies can negatively affect speech understanding in noise to various extents. In a study by Feng et al. to investigate this effect, speech perception in noise at 2, 3, and 4 kHz was assessed in a group with normal hearing and 3 groups of HF-SNHL using the HINT test, in which the speeds were changed by applying different rates of time compression 3. The study revealed that the HF-SNHL groups performed lower than the normal hearing group even at normal speech rates. In addition, it was shown that performance was lower as the compression rate increased in all groups. The data obtained in our study are consistent with these results. We found that the SRT obtained in adaptive noise assessments in the HF-SNHL group was significantly higher than in the control group (p < 0.05). In addition, significantly lower scores were obtained in the study group in non-adaptive SI percentages compared to the normal hearing group (p < 0.05) (Tab. II).
Self-assessment of the perceived communication skills of patients with hearing loss using questionnaires and scales has been a topic that has been evaluated since the beginning of audiology. SSQ enables individuals with hearing loss to reveal the situations they encounter in daily life, to determine the difficulties they experience in finding the location and direction of sounds, and to make assessments about the quality of hearing. For this purpose, we investigated the effect of HF-SNHL on individuals using SSQ. We found a significant difference (p < 0.05) between the study group and normal hearing group in the overall means of the SSQ, Speech Perception scores, Spatial Perception scores, and Quality of Hearing scores. The group with hearing loss had lower scores compared to the control group. In a previous study, it was observed that individuals with hearing loss scored lower on the scales 18,22. In a study of normal hearing and bilaterally hearing-impaired individuals, lower SSQ values were observed in the group with hearing loss 22. In our study, results consistent with the literature were found.
It is important to investigate the correlations between high frequency thresholds, which are the most prominent indicators of hearing loss, and the tests applied. In our study, a positive and weak correlation was observed between HF averages (4, 6, and 8 kHz) and GDT and RGDT. These results showed that temporal resolution may decrease with HF-SNHL. Moreover, a high positive correlation was observed between the HF threshold average and TMT’s SRT in noise and a high negative correlation was observed between the HF average and TMT -5 SNR SI, SSQ mean, and Speech Perception subscale of SSQ. All these results indicate that as the degree of hearing loss at high frequencies increases, problems in speech recognition in noise will increase and at the same time low scores may be obtained from the scale.
Correlations between the tests used in temporal resolution assessment were analysed. Hoover, Pasquesi, and Souza evaluated the correlation between the GIN test and the GDT using a noise stimulus created on MATLAB and found a strong positive correlation between the 2 tests 14. However, when we examined the difference between the GDT and Composite RGDT values in our study, a positive but weak correlation was observed between the 2 tests. It was thought that these differences in correlation strength between the 2 studies might be due to the different frequency characteristics of the stimuli used in the test.
In some studies, a correlation was observed between temporal resolution tests and speech comprehension tests in noise, while in others no correlation was observed. In the present study, a positive, moderate correlation was observed between the GDT and adaptive procedure SRT, and a negative, moderate correlation was observed with the non-adaptive procedure SI. This suggests that as the gap detection threshold increases and temporal resolution decreases, it is possible to have a relatively higher SRT value and lower SI. With decreasing temporal resolution, it has been shown that speech understanding problems may occur in noise. Hoover et al. showed that there was a moderate positive correlation between the QuickSIN test for speech recognition in noise and the GDT 14. In our study, results consistent with the study by Hoover et al. were obtained. Cesur and Derinsu showed a weak negative correlation between GIN and speech recognition in noise score 5. Li et al. showed a negative correlation between the gap thresholds determined with a 1 kHz low-pass filtered white noise stimulus and time-compressed speech scores in a study involving individuals with high frequency sensorineural hearing loss and normal hearing 4. In our study, no significant correlation (p > 0.05) was observed between the composite RGDT value using tonal stimuli and the SRT and SI, which are the other temporal resolution tests we applied in our study. Our findings support Strouse et al. In that study, a gap detection test with a 1000 Hz signal was used to assess temporal resolution, and a syllable recognition test with VOT change between /ba/-/pa/ syllables was used to assess speech recognition and no significant correlation was found between the 2 tests 23. A possible reason for these differences may be that the stimuli used in the test have different characteristics as noise and pure tone. According to these results, it is thought that tests using noise stimuli may be relatively more preferred in evaluating temporal resolution and difficulties in noise.
No significant correlation was observed between the GDT and the overall mean of the SSQ, which evaluates the hearing perception of individuals (p > 0.05) in the present study. However, a significant, negative, and weak correlation was observed between the GDT and subscales of SSQ. The finding of a correlation, albeit weak, between the GDT and Speech Perception scale, which mostly assesses speech perception in noise environments, may support the relationship between decreased temporal resolution and difficulty in speech intelligibility in noise. At the same time, a negative and weak correlation was found between the composite RGDT score and the SSQ overall mean and Speech Perception subscale. This may indicate that when temporal resolution decreases, individuals may be able to express the situation subjectively, albeit weakly.
Our study contributes to the literature in terms of presenting the relationship between the 2 tests in adaptive and non-adaptive procedure TMT applied to the same groups. Our results show a negative and moderate correlation between SRT in Adaptive Noise (TMT) and SSQ overall mean and Speech Perception subscale. As the SRT decreases, SSQ overall mean and Speech Perception scores increase. The fact that there is a positive and moderate correlation between the SI in non-adaptive noise at -5 SNR, which is one of the most difficult conditions of the TMT, and the SSQ overall mean indicates that as the percentage of SI in noise increases, individuals get higher scores on the scale. Indeed, the observation of a significant positive and moderate correlation between the TMT SI and the subscale of SSQ, which consists of various questions to assess speech recognition in different environmental conditions such as noise and reverberation, indicates that this part of the scale moderately predicts the subjective assessment of speech recognition in noise. According to these results, it appears that the scale is relatively reliable in the assessment of HF-SNHL. Our study has also contributed to the literature in terms of establishing the relationship between Turkish TMT and SSQ.
Numerous research in the literature provides evidence for comparable findings. Vannson et al. investigated the relationship between the SSQ and SRTs in spatially separated noise with the French Matrix test in adults with asymmetric hearing loss who were between the ages of 20 and 70 19. The SSQ overall mean and subscale of SSQ values in this study showed a significant negative correlation with the dichotically presented situation. Examining these findings reveals that our data are in line with previous research (Tab. IV).
Decision tree calculations for our secondary objective revealed the importance of the results obtained from the scale. According to the tree structure in the results, the fact that the Speech Perception score, which is the subtest of the SSQ, was selected as the first criterion for the individual to be included in the study group is an indication of this. Thus, 24 in the study group of 30 individuals were identified as patients. Subsequently, the SRT evaluation of the TMT was used as the second criterion for the 6 patients included in the normal group to be included in the study group. As a result, 5 of the remaining 6 individuals could be included in the study group. The fact that individuals were identified as patients according to these 2 assessment methods strongly suggests that these measures are very important in test batteries and should be included in the evaluations of HF-SNHL. At the same time, despite the limited sample size, the prominence of the scale results in deciding the disease status supports the necessity of scale assessments in deciding whether to refer individuals to the clinic for audiological evaluation. The subsequent use of noise perception tests as a second criterion suggests that these tests should be added to the battery when assessing individuals. In addition, to make these decisions more accurately, it is planned to increase the number of individuals, which is one of the limitations of the present study, and to make calculations including other characteristics. According to our research, there is no previous study that reveals these relationships using a decision tree, and our study makes an innovative contribution to the literature in this respect. Given the relatively small sample size, the model’s high specificity value suggests a risk of overfitting. Achieving near-perfect classification performance on the training set indicates that the model may have learned a sample-specific structure. Therefore, it should be noted that the threshold values determined by the decision tree model may vary across different samples. In future studies, it is recommended to perform generalisability tests using independent sample validation or ROC analysis.
Self-assessment scales have been suggested to have the potential to assess perceived hearing function in real-world listening environments that cannot be easily replicated in laboratory or clinical scenarios. They have also been used as an outcome measure after hearing aids and implant fitting. Self-perception of hearing ability has also been shown to predict which patients prefer amplification 24. Self-assessment scales have also shown that patients with higher levels of motivation are more likely to seek help for their problems 25. Generally, the start time of amplification is delayed by individuals with HF-SNHL. Revealing the problems experienced by individuals in many areas with comprehensive assessments can shorten this process. In this case, the use of self-assessment scales that increase the self-awareness of individuals becomes important. At the same time, when we consider the strong correlation between the SSQ and the Turkish Matrix test and the relationship in the decision tree calculation, it reveals the importance of using scales in evaluations. Thus, individuals who are more aware of the difficulties they experience can contribute to deciding on solutions that will increase their quality of life.
The small sample size of this study and the absence of longitudinal data are important limitations. These factors may limit the generalisability of the findings and the causal interpretation of relationships between variables, as the study is based on a cross-sectional design. Future studies with larger samples, incorporating longitudinal follow-up data, may more robustly elucidate the nature of these relationships.
Conclusions
Since individuals with HF-SSHL have difficulties in understanding speech in noise, it is necessary to include speech in noise recognition tests in the test batteries when evaluating these individuals. At the same time, it is important to evaluate individuals with scales so that they can more easily express and document the subjective complaints they experience. It is thought that assistive device referrals can be made more accurately for people who are evaluated with temporal resolution tests, speech recognition in noise tests, and scales. This detailed evaluation can be used as a guide for early intervention if necessary. It may help to explain the importance of this condition to the individuals. Thus, effective decisions can be made to improve the quality of life of individuals with HF-SNHL.
Acknowledgements
The authors declare that there were no contributors who met the criteria for acknowledgement but not authorship.
Conflict of interest statement
The authors declare no conflict of interest.
Funding
This research received no specific grant from any funding agency in the public, commercial, or not-for-profit sectors.
Author contributions
BG, ZP: idea/concept, Design; ZP: control/supervision; BG: data collection and/or processing, literature review; BG, RA: writing the article, critical review; BG, RA, ZP: references and fundings.
Ethical consideration
This study protocol was reviewed and approved by Istanbul University-Cerrahpaşa Medical Faculty Clinical Research Ethics Committee dated 06.09.2018 (approval number: 52165). All procedures were performed in accordance with the ethical standards of the institutional research committee and with the 1964 Helsinki declaration and its later amendments. Written informed consent was obtained from all participants included in the study.
History
Received: May 24, 2025
Accepted: March 4, 2026
Figures and tables
Figure 1. Pure-tone thresholds of the study (left) and control (right) groups by frequency.
Figure 2. Decision tree statistical analysis values.
| Study group | Control group | ||||||
|---|---|---|---|---|---|---|---|
| n | Mean ± SD | n | Mean ± SD | t | Cohen’s | p | |
| (ms) | (ms) | d | |||||
| GDT | 30 | 3.72 ± 2.1 | 30 | 2.52 ± 0.97 | -2.9 | 0.74 | 0.006*1 |
| 500 Hz RGDT | 30 | 15.57 ± 15.1 | 30 | 7.43 ± 5.36 | - | 0.72 | 0.007*1 |
| 1000 Hz RGDT | 30 | 14.03 ± 14.66 | 30 | 6.57 ± 4.09 | - | 0.69 | 0.01*1 |
| 2000 Hz RGDT | 30 | 14.23 ± 14.02 | 30 | 6.83 ± 4.04 | -2.8 | 0.72 | 0.007*1 |
| 4000 Hz RGDT | 30 | 14.83 ± 13.99 | 30 | 6.30 ± 4.12 | -3.2 | 0.84 | 0.002*1 |
| Composite RGDT threshold | 30 | 14.75 ± 14.04 | 30 | 6.72 ± 3.91 | -3.02 | 0.78 | 0.004*1 |
| *p < 0.05. GDT: gap detection test; RGDT: random gap detection test; ms: milliseconds; SD: standard deviation; n: number of participants; t: Welch test 1 independent samples T test. | |||||||
| Study group | Control group | ||||||
|---|---|---|---|---|---|---|---|
| n | Mean ± SD | n | Mean ± SD | t | Cohen’s | p | |
| (ms) | (ms) | d | |||||
| SRT | 30 | -3.4 ± 2.2 | 30 | -6.2 ± 0,.9 | -6.54 | 1.67 | < 0.001*1 |
| SI -5 SNR (%) | 30 | 50.8 ± 15.95 | 30 | 80.1 ± 7.2 | 9.17 | 2.37 | < 0.001*1 |
| *p < 0.05. SRT: speech recognition threshold; SNR: signal to noise ratio; SI: speech intelligibility; SD: standard deviation; n: number of participants; t: Welch test; 1 independent samples T test. | |||||||
| Study group | Control group | ||||||
|---|---|---|---|---|---|---|---|
| n | Mean ± SD | n | Mean ± SD | t | Cohen’s | p | |
| (ms) | (ms) | d | |||||
| Speech perception | 30 | 6.57 ± 1.13 | 30 | 8.52 ± 0.64 | 8.2 | 1.39 | < 0.001*1 |
| Spatial perception | 30 | 7.12 ± 1.39 | 30 | 8.65 ± 0.7 | - | 0.72 | < 0.007*1 |
| Quality of hearing | 30 | 7.57 ± 1.13 | 30 | 9.07 ± 0.63 | 6.34 | 1.64 | < 0.001*1 |
| Overall mean scores | 30 | 7.13 ± 1.07 | 30 | 8.77 ± 0.51 | 7.6 | 1.96 | < 0.001*1 |
| *p < 0.05. SD: standard deviation; n: number of participants; t: Welch test; 1 independent samples T test. | |||||||
| r | GDT | RGDT | SRT | – 5 SNR | SSQ | SSQ |
|---|---|---|---|---|---|---|
| SI | Overall mean | Speech perception | ||||
| HF threshold averages | 0.3*1 | 0.3*1 | 0.74**1 | -0.84**1 | -0.6**1 | -0.62**1 |
| GDT | 0.34*1 | 0.4*1 | -0.4*1 | -0.221 | -0.28*1 | |
| RGDT | 0.2***1 | -0.21***1 | -0.36*1 | -0.33*1 | ||
| SRT | -0.46**1 | -0.48**1 | ||||
| – 5 SNR SI | 0.54**1 | 0.54**1 | ||||
| *Correlation is significant at 0.05 level (2-tailed); **Correlation is significant at 0.001 level (2-tailed); ***Correlation is not significant; r: correlation coefficient; HF: high frequency; GDT: gap detection test; RGDT: random gap detection test; TMT: Turkish matrix test; SRT: speech recognition threshold; SNR: signal-to-noise ratio; SI: speech intelligibility; SSQ: speech, spatial and qualities of hearing scale; 1 pearson correlation test. | ||||||
References
- Hoffman H, Dobie R, Losonczy K. Declining prevalence of hearing loss in US adults aged 20 to 69 years. JAMA Otolaryngol Head Neck Surg. 2017;143:274-285. doi:https://doi.org/10.1001/jamaoto.2016.3527
- Moore B. Cochlear Hearing Loss: Physiological, Psychological and Technical Issues. John Wiley & Sons; 2007.
- Feng Y, Yin S, Kiefte M. Temporal resolution in regions of normal hearing and speech perception in noise for adults with sloping high-frequency hearing loss. Ear Hear. 2010;31:115-125. doi:https://doi.org/10.1097/AUD.0b013e3181bb69be
- Li B, Guo Y, Yang G. Effects of various extents of high-frequency hearing loss on speech recognition and gap detection at low frequencies in patients with sensorineural hearing loss. Neural Plast. 2017;2017. doi:https://doi.org/10.1155/2017/8941537
- Cesur S, Derinsu E. Effect of aging on temporal resolution. Turk Geriatri Derg. 2017;20.
- Yin S, Feng Y, Chen Z. The effect of noise-induced sloping high-frequency hearing loss on the gap-response in the inferior colliculus and auditory cortex of guinea pigs. Hear Res. 2008;239:126-140. doi:https://doi.org/10.1016/j.heares.2008.02.002
- Shannon R, Zeng F, Kamath V. Speech recognition with primarily temporal cues. Science. 1995;270:303-304. doi:https://doi.org/10.1126/science.270.5234.303
- Camarata S, Werfel K, Davis T. Language abilities, phonological awareness, reading skills, and subjective fatigue in school-age children with mild to moderate hearing loss. Except Child. 2018;84:420-436. doi:https://doi.org/10.1177/0014402918773316
- Woods D, Yund E, Herron T. Measuring consonant identification in nonsense syllables, words, and sentences. J Rehabil Res Dev. 2010;47.
- Tobias J. Relative occurrence of phonemes in American English. J Acoust Soc Am. 1959;31. doi:https://doi.org/10.1121/1.1907766
- Stelmachowicz P, Pittman A, Hoover B. Effect of stimulus bandwidth on the perception of /s/ in normal- and hearing-impaired children and adults. J Acoust Soc Am. 2001;110:2183-2190. doi:https://doi.org/10.1121/1.1400757
- Pittman A, Stelmachowicz P, Lewis D. Spectral characteristics of speech at the ear. J Speech Lang Hear Res. 2003;46:649-657. doi:https://doi.org/10.1044/1092-4388(2003/051)
- Beamer S, Grant K, Walden B. Hearing aid benefit in patients with high-frequency hearing loss. J Am Acad Audiol. 2000;11:429-437. doi:https://doi.org/10.1055/s-0042-1748130
- Hoover E, Pasquesi L, Souza P. Comparison of clinical and traditional gap detection tests. J Am Acad Audiol. 2015;26:540-546. doi:https://doi.org/10.3766/jaaa.14088
- Kim S, Frisina R, Mapes F. Effect of age on binaural speech intelligibility in normal hearing adults. Speech Commun. 2006;48:591-597. doi:https://doi.org/10.1016/j.specom.2005.09.004
- Bae J. The clinical decision analysis using decision tree. Epidemiol Health. 2014;36. doi:https://doi.org/10.4178/epih/e2014025
- Bidelman G, Jennings S, Strickland E. PsyAcoustX: a flexible MATLAB package for psychoacoustics research. Front Psychol. 2015;6. doi:https://doi.org/10.3389/fpsyg.2015.01498
- Kılıç N. Konuşma, Uzaysal Algı Ve İşitme Kalitesi (KUİK) Ölçeğinin Türkçeye Uyarlanıp Normalizasyonunun Yapılarak; Normal İşiten Ve Sensörinöral İşitme Kayıplı Yetişkin Bireylerde İncelenmesi. Gazi Üniversitesi Sağlık Bilimleri Enstitüsü; 2017.
- Vannson N, James C, Fraysse B. Quality of life and auditory performance in adults with asymmetric hearing loss. Audiol Neurotol. 2015;20:38-43. doi:https://doi.org/10.1159/000380746
- Matos G, Frota S. Temporal resolution in sensorineural hearing loss. Audiol Commun Res. 2013;18:30-36.
- Balzan P, Tabone N. Auditory temporal order and resolution in younger and older Maltese adults. Malta J Health Sci. 2017;4:3-11.
- Batthyany C, Schut A, van der Schroeff M. Translation and validation of the speech, spatial, and qualities of hearing scale (SSQ) and the hearing environments and reflection on quality of life (HEAR-QL) questionnaire for children and adolescents in Dutch. Int J Audiol. 2023;62:129-137. doi:https://doi.org/10.1080/14992027.2021.2020914
- Strouse A, Ashmead D, Ohde R. Temporal processing in the aging auditory system. J Acoust Soc Am. 1998;104:2385-2399. doi:https://doi.org/10.1121/1.423748
- Palmer C, Solodar H, Hurley W. Self-perception of hearing ability as a strong predictor of hearing aid purchase. J Am Acad Audiol. 2009;20:341-347. doi:https://doi.org/10.3766/jaaa.20.6.2
- Ridgway J, Hickson L, Lind C. What factors are associated with autonomous and controlled motivation for hearing help-seekers?. J Am Acad Audiol. 2017;28:644-654. doi:https://doi.org/10.3766/jaaa.16098
Downloads
License

This work is licensed under a Creative Commons Attribution-NonCommercial-NoDerivatives 4.0 International License.
Copyright
Copyright (c) 2026 Società Italiana di Otorinolaringoiatria e chirurgia cervico facciale
How to Cite
- Abstract viewed - 327 times
- PDF downloaded - 83 times