


Audiology
Vol. 46: Issue 4 - August 2026
Evaluation of neural transmission in implanted patients with Meniere’s disease
Authors
Ashley Baguant
 , Vincent Pean
, Fabien Seldran
, Kamalkishore Baguant
, Sebastien Schmerber
, Raphaele Quatre
, Vincent Pean
, Fabien Seldran
, Kamalkishore Baguant
, Sebastien Schmerber
, Raphaele Quatre
Summary
Cover Image
Introduction. Meniere’s disease (MD) is characterised by fluctuating hearing loss. When hearing loss is severe or profound, rehabilitation requires cochlear implantation. The aim of this retrospective study was to compare cochlear implant (CI) fittings and electrode impedances between patients implanted because of MD and those with other aetiologies.
Materials and methods. This study involved patients who received cochlear implantation with MED-EL CI at our centre between 2005 and 2022. We first compared speech recognition in a quiet environment at one year after cochlear implantation. We then performed a comparative study of the electrode impedances and most comfortable levels at activation, 2, 3, 6, and 12 months after activation.
Results. Out of the 218 patients included in our study, 21 were diagnosed with MD. There was no significant difference in speech intelligibility in a quiet environment between the 2 groups. Electrode impedances were statistically comparable in both groups. However, MCLs for the 2 most apical electrodes were higher in the MD group during the first 2 months after surgery.
Conclusions. This study found a need for electrical stimulation at higher intensities in low-frequency electrodes during the early months after cochlear implantation in MD.
Introduction
Meniere’s disease (MD) is an inner ear disease generally attributed to endolymphatic hydrops, which is an excess of fluid in the inner ear responsible for an increase in hydrofluid pressure. The diagnosis of MD is mainly based on the criteria established by the Barany Society in 2015 1, i.e. the occurrence of at least 2 episodes of vertigo lasting between 20 minutes and 12 hours for definite MD and up to 24 hours for probable MD, fluctuating low to mid-frequency sensorineural hearing loss confirmed through audiometry as well as fluctuating aural symptoms. If hearing loss is not documented, the medical history can favour probable MD 1.
To date, there is no universally accepted cure for MD. Medical treatments such as betahistine, diuretics, and corticosteroids can reduce the frequency and severity of vertigo attacks. However, when these treatments become ineffective, more invasive options can be considered. These include trans-tympanic gentamicin injections 2 or surgeries such as endolymphatic sac decompression, surgical labyrinthectomy, and vestibular neurectomy 3.
For patients with MD who have severe hearing loss, particularly in the low to mid-frequency bands, with severe tinnitus impacting their daily life, hearing aids may be ineffective 4 due to fluctuating hearing levels 5 and sound distortion. In such cases, cochlear implantation (CI) becomes a suitable alternative.
Most studies on speech comprehension after cochlear implantation in MD have shown good results, not differing significantly from other causes of deafness 6,7. Moreover, the fact that some patients underwent prior or concomitant surgeries, such as endolymphatic sac decompression, labyrinthectomy, or trans-labyrinthine vestibular neurectomy, had no impact on the hearing outcomes after cochlear implantation 8,9.
However, some authors have noted fluctuations in hearing performance among cochlear implanted MD patients 5,10, but without bringing forward a plausible explanation. A comparative study of electrode impedance and cochlear implant (CI) fitting thresholds between MD patients and non-MD patients has not yet been published. The results of such a study could bring greater understanding as to the mechanism of the disease.
The main objective of our study was to compare, through a retrospective analysis of cochlear-implanted patients, the electrode impedances between a group of MD patients and a group with other aetiologies (OA).
Materials and methods
Patients
This retrospective monocentric study included all adult patients who received a unilateral MED-EL CI in our ENT department between January 2005 and January 2022. Even if some patients required bilateral CIs during the same surgical procedure because of the risk of ossification, as recommended by our ENT National Society, our study focused only on patients who received unilateral CI. The following indications implying simultaneous bilateral cochlear implantation because of the onset of profound bilateral hearing loss were therefore excluded: bilateral trans-labyrinthine fractures and bilateral hearing loss due to meningitis. Moreover, as the follow-up duration for each patient lasted one year, patients who underwent successive bilateral CIs within a delay of less than one year were also excluded from our study.
Two groups of patients were studied: a group with MD and a group with OA. The cause of the hearing loss was collected from the medical record of the patients. The OA had no history of fluctuating hearing loss or other clinical data in favour of hydrops or anything else. The medical cause of hearing loss was either known precisely (otosclerosis, sudden hearing loss, genetic cause, post-traumatic, infectious) or was defined as “unknown”. We did not subdivide groups of patients in the OA group, so that it was considered as a whole to be homogenous. The symptoms in MD are well defined by the criteria of the Barany Society, and the probability that a patient with an unknown cause being mistakenly taken for MD and vice versa was quite low.
Indications for cochlear implantation were severe to profound hearing loss on the ear concerned and a speech discrimination test in a quiet environment at 65 decibel hearing level (dB HL) with well adapted bilateral hearing aids being below 50% (French criteria for cochlear implantation). The surgical technique performed was a round window insertion procedure to access the scala tympani.
We first compared speech recognition in quiet at one year after cochlear implantation between MD and OA patients with MED-EL CIs (MED-EL, Innsbruck, Austria).
We also compared electrode impedances and most comfortable level thresholds (MCL) at one, 2, 3, 6, and 12 months after surgery in both the MD and OA groups.
Speech recognition in a quiet environment
The vocal material consisted of word-lists presented at an intensity of 60 dB HL. Two types of lists were used separately: the monosyllabic Lafon lists (each with 17 words) and the disyllabic Fournier lists (each with 10 words). Patients were evaluated in free field conditions, sitting at 1 m in front of the loudspeaker in a sound booth. The recognition score was recorded as the percentage of correct answers for each type of list in 2 different conditions: with the CI alone (contralateral ear not plugged/masked) and with the CI and contralateral hearing aid if any. In the CI alone condition, some patients remained bimodal because the hearing loss on the non-implanted side was not always total. If the hearing loss on the non-implanted side was severe or profound, we considered that testing the implanted side without plugging or masking the contralateral ear would not affect the results.
Cochlear implant fittings
The stimulation strategy in our centre is as follows: first, the activation aims to get hearing sensation, and then fittings are provided during the following months, gradually increasing up to the MCL threshold to improve the patients’ hearing. All patients were implanted with Flex28 electrodes which are flexible lateral wall electrodes of 28 mm.
Each electrode can be considered to be a capacitor. When electrical charges appear in an electrode, a polarisation is induced in the synapse and a nerve impulse is fired when the polarity changes suddenly. For each capacitor, the factors influencing the transmission of electrical energy are: the surface area where the charges are accumulated, the distance between that surface and the nerve endings, and the capacitance 11. In case of constant electrical stimulation, the greater the charges, the greater the energy transfer to the synapse. The charges delivered will depend upon the impedance of the capacitor and the intensity of the electrical current needed to be delivered. For those reasons, we compared the charge Q in “qu” units, which is the standard unit used by MED-EL, and the impedance in “kilo-ohm” when comparing the patients with MD and with OA to see if there was any difference in electrical stimulation. Although each patient may have different global electrode map fittings, we decided to take into account only the ones with the higher stimulation. These were the ones that could be reached and accepted as strong enough to be the most useful, but not excessive during the fitting session and therefore recommended for daily use.
The intensity of stimulation for each electrode can vary between a minimum called the threshold level (THR) and a maximum called the MCL. These 2 limits define the dynamic range of electrical stimulation. The higher the MCL, the higher the intensity of stimulation. The input-output relationship between the THR and the MCL follows a logarithmic curve. Thus, MED-EL software allows to reduce the stimulation to a percentage of the MCL. By doing so, it increases the comfort of the patient while keeping the initial relationship between the input and the output. The maximum amount of charge on the electrode is therefore never reached while patients get to their comfortable level. In our study, we considered the charges needed to stimulate at a certain percentage of each MCL level as fixed by the audiologist operators with the MED-EL software. For reasons of simplicity, this determined maximum threshold will be simply called the MCL.
Furthermore, any MCL value that was 4 times above the standard deviation (SD) of the mean MCL calculated on all patients at one-year post-implantation was excluded from the data as it differed too much from usual ranges. A patient with more than half of electrodes excluded because of unusual MCLs was not included in the data analysis. Considering the basal electrodes, in some cases, they were out of the cochlea due to the surgical procedure. In those cases, they were simply deactivated. For MED-EL, electrode 1 is the most apical one whereas electrode 12 is the most basal. We therefore divided the electrodes between apical (1 to 3), median (4 to 9) and basal (10 to 12).
Statistical analysis
A Shapiro-Wilk test was performed to check if the normal distribution model fits the data. If not significant, a t-test was used to compare the MD and OA groups, otherwise a Mann-Whitney (M-W) test was applied. Because of multiple comparison, the Bonferroni correction method was applied to avoid inflation of the alpha risk. Two parameters were to be considered, the number of electrodes and the different measurements over time. The multiple comparison considering the time parameter is a potential confusion bias. For that reason, a Bonferroni correction was directly performed on the p-value of the results through the time parameter. The significance level chosen was a p value < 0.05.
Our analysis was exploratory, and even if the electrodes are independent of one another, the results obtained were secondarily submitted to a second Bonferroni correction considering 12 different comparisons (for each electrode) to avoid statistical bias.
Results
Patients
In this study, 218 patients were included: 21 with MD and 197 with OA. All patients included were over 40 years of age when implanted. In our centre, all patients were implanted with Flex28 electrodes which are flexible lateral wall electrodes. The characteristics of the population are shown in Table I.
Among MD patients, one patient had had an endolymphatic sac decompression 10 years before the CI surgery, and 2 had had a simultaneous surgical posterior labyrinthectomy. No patient had a simultaneous translabyrinthine neurectomy.
Speech recognition in a quiet environment
Table II presents the mean and standard deviation for monosyllabic and disyllabic speech recognition tests in a quiet environment one year after implantation for the OA and MD groups. The numbers of patients indicated in Table II differ from the 21 MD and the 197 OA patients enrolled due to missing data. The results showed no significant difference between the 2 groups with or without a contralateral hearing aid and whichever speech recognition list chosen.
MED-EL cochlear implant settings
For this part of the study, only the data concerning patients implanted after 2010 were available. The number of MED-EL patients was thus reduced from 21 to 20 in the MD group and from 197 to 147 in the OA group.
Electrode impedances
We collected the data for each electrode at activation day (one month) and at 2, 3, 6, and 12 months after cochlear implantation. Table III shows the mean impedance for each electrode. In some cases, MED-EL software (MAESTRO latest version at the time of the fitting from 4.0.1 to 7.0.3) automatically considered the impedance to be too high and instead of giving a numerical value, displayed “HI” (high impedance) on the screen. In such cases, no fitting could be done on the concerned electrodes, and they were simply deactivated.
There was a significant difference in impedance between MD and OA for the 5th electrode at 2 months and for the 9th electrode at 6 months post-implantation (Tab. III). However, after Bonferroni correction (0.05/12 = 0.004) these differences were no longer significant.
Table IV shows the evolution of impedance in the global cohort of patients with MD and OA. It highlights a decrease of impedance with time in the electrodes 1 to 8 whereas for the electrodes 11 to 12 the impedance tends to increase significantly. This result was significant after Bonferroni correction with a p-value of 0.004.
Figure 1 shows the evolution of the average impedance for each electrode over time after implantation for all patients.
MCL measurements
As mentioned in the previous section, none of the MCL that were greater than 4 times the standard deviation above the mean values of the global cohort at 12 months concerning an electrode were included in the study. The removed data concerned 2 patients at one, 3 and 6 months, one patient at 2 months, and 4 patients at 12 months. All of them were in the OA group.
Table V shows the mean MCL among MD and OA. The results show that the MCL thresholds were higher for the 2 apical electrodes (1, 2) during the first 2 months after cochlear implantation in the MD group and later evolved towards values that were not different, even if their MCL continued to maintain higher values. However, after applying Bonferroni correction (0.05/12 = 0.004) these differences were not statistically significant.
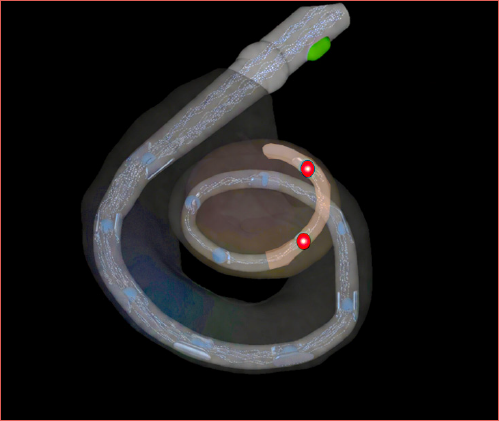
Figure 2 shows a comparison between the average MCL of MD and OA from the first month to one year after cochlear implantation grouping apical, median and basal electrodes as defined in the previous section. Figure 2 and the Cover figure both show that even without statistical significance (as shown in Table V), there is a tendency for the 3 most apical electrodes to have greater MCL values even after 6 months in the MD group.
Finally, Figure 3 shows the relationship between MCLs and electrode impedances. Each dot corresponds to a mean value measured at respectively one, 2, 3, 6 and 12 months after implantation. Over time, the MCL value increased while the impedance decreased so that patients get progressively accustomed to the electrical stimulation and the performances with the CI improved. Focusing on the apical electrodes, it can be seen that the MCLs were lower than 14qu at one month and around the same threshold at 2 months in the MD group. In the OA group, the MCLs are much higher but with quite similar impedance compared to MD patients which means that the MCL/impedance ratio is higher in the OA than in the MD group. Much more energy is consequently sent during the first months in the apical electrodes for patients with MD.
Discussion
This study shows that one year after surgery, speech recognition in a quiet environment does not differ between the MD and OA groups, which is consistent with findings from other studies 7,9,12. For MED-EL CI, concerning all patients (with MD and OA) as represented in Figure 1, the impedances of electrodes 1 to 8 tend to show a decrease with time, while electrodes 11 and 12 tend to increase. However, all electrodes seem to converge over time towards similar values regardless of whether the patient had MD or OA. Lastly, for the 2 most apical electrodes (1 and 2), there was a difference in the MCL between the 2 groups during the first 2 months following cochlear implantation, but this was not significant after Bonferroni correction considering the number of electrodes.
Our study is retrospective, and data were not always available for all patients. Considering the speech recognition scores in a quiet environment, even if there were no significant differences, the missing data decreased the power of this result. One could argue that the absence of plugging/masking of the contralateral ear during the hearing tests on the implanted side could have given faulty results in patients with less hearing loss on the other side, thus contributing to better scores. However, since cochlear implantation was only performed on patients with severe to profound bilateral hearing loss, we considered that the absence of masking would have no impact on the results.
We found a decrease of impedance for the electrodes 1 to 8. The variation in electrode impedance has been documented in studies involving the Nucleus CI (Cochlear®) 13 and MED-EL CI 14. Van Wermeskerken et al. demonstrated that without electrical stimulation, electrode impedance increased when they compared the values obtained during the surgical procedure to those measured one month later 14. Moreover, Alahmadi et al. found that early activation on the day after surgery and stimulation resulted in lower impedance compared to the situation where the activation of the CI started at one month after implantation 15. Those studies clearly demonstrate that early electrical stimulation is associated with a decrease of impedance, thus giving an explanation for our results in the apical electrodes.
As for the two most basal electrodes (11 and 12), the impedance increases significantly after 3 months. The basal electrodes, being near the drilling site of the round window overhang, new bone, and fibrous tissue formation, appear during the months following surgery 16. The presence of compact tissue between the electrode and the nerve endings can decrease the electrical conduction despite electrical stimulation.
For the 9th and 10th electrodes, there was no significant change in the values between the date of activation and 12 months after surgery. One possible explanation could be that these electrodes are located in a transition area where the electrical stimulation effect which decreases the impedance is counterbalanced by fibrous scar or bone renewal tissue which tends on the contrary to increase the impedance.
The mean electrical impedances of the electrodes between patients with MD and OA were statistically comparable.
The MCL in the MD group remained higher in the 2 most apical electrodes (1 and 2) within the first 2 months after implantation with mean thresholds above 14qu in the MD group compared to the OA group. Even if the results were not statistically significant after the second Bonferroni correction, it is quite undeniable that there is a tendency of having higher MCLs in the MD group.
The MED-EL stimulation strategy focuses on maximising the coverage of the scala tympani in the cochlea in order to decrease the tonotopic frequency mismatch 17. The apical electrodes code for low frequency signals which correspond to the bands that are usually impaired in MD 1,18. The MCL as defined by the manufacturer corresponds to the stimulation needed to make a patient hear a sound at a hearing level of approximately 105 dB sound pressure level (SPL) 19. Since relationship between the input and the output signal is an increasing function between the THR and the MCL 19, our findings imply that there is a need for higher intensity stimulation at low frequencies in MD patients at least during the first 2 months after implantation.
After 3 months, the MCLs both in MD and OA patients tend to become equivalent even if, as shown in the Cover figure and Figure 2, the MCL-thresholds seem higher in the MD group up to 6 months after cochlear implantation. One could argue that the sample size of the MD group might not be large enough to reveal a statistically significant difference. Indeed, the MD group consisted of only 20 patients and was compared to a control group of 147 patients.
Histopathologic studies on human temporal bone have shown that the lesions in the cochlea are mostly found in the apical zone 20,21. Horner suggested the following explanation: hydrops is an increase of pressure in the scala tympani which compresses the scala vestibuli 20. Hydrops, once permanently established, induce fluid reflux from the perilymphatic sector towards the endolymph through the helicotrema. This induces an alteration with an increase of the endolymph potassium concentration which in turn damages neural fibres and stereocilia of the outer cells at the apex 20. Because of the architecture of the cochlea and the physical properties of the Reissner membrane, the tensile stress produced by hydrops is maximum at the apex. Hydrofluid pressure caused by hydrops may exceed the elastic capacity of the Reissner membrane and thereby inducing its plastic and irreversible deformation at the apex 22. Cochlear implantation is indicated when the hearing loss is severe to profound, which usually implies a long history of MD. In such cases, a rupture of the Reissner membrane can be expected due to chronic endolymphatic high pressure 23, which would create an increase in the level of potassium in the endolymphatic fluid according to Horner’s hypothesis 20.
The increase of the MCL in the apical sector of the cochlea in MD patients found in our study does not seem to be exactly compatible with modification of the ionic composition or high pressure at the apex. Firstly, the MCLs of the apical electrodes should have remained constantly higher in the MD patients even after the lapse of 2 months instead of becoming equivalent to the OA patients. Secondly, a modification of the endolymphatic pressure or of its ionic composition would have modified the medium permittivity and therefore the impedance. This also was not found in our study.
The difference in hearing loss between the frequency bands in MD patients could therefore be related to either damage of the cochlear synapses (synaptopathy) or lesions of nerve fibres (neuropathy) 24. Auditory synaptopathy, characterised by the loss or dysfunction of cochlear nerve synapses, has been previously described in patients with presbycusis, ototoxicity and noise-induced trauma 24. Auditory synaptopathy should be distinguished from neuropathy where the cochlear nerve is directly affected by either neural loss or damage of the myelin sheath surrounding the nerve fibres. In animal models, endolymphatic hydrops can be induced by the removal of the endolymphatic sac. However, even before the onset of the hydrops created by the endolymphatic sac resection, hearing loss has been found to result from synaptic losses in the first turn of the cochlea 25.
One possible explanation for the higher MCLs found in MD patients during the first months for the apical electrodes could be the following: with weaker initial electrical stimulation, only the synapses are stimulated. However, as the electrical intensity increases, the electrical field expands and stimulates the nerve itself in the spiral ganglion or even further. This hypothetical explanation resulting from our study could imply that there is synaptopathy in MD patients predominantly in the lower frequency bands due to the pathological mechanism of the disease. Nadol et al.21 provided the hypothesis of focal disorders that explained the hydrops. The chronic evolution which is mainly in the apex of the cochlea may result in synapse disorder. This new paradigm does not go against the fact that MD patients have outcomes as good as OA patients and that mean speech intelligibility does not differ significantly between the 2 groups of patients 12 months after cochlear implantation. The values of the MCLs measured were considered to depend only on the electrodes concerned (MED-EL personal communication). However, these results were exploratory and could be limited by the multiplicity of comparisons. If the Bonferroni correction was applied, the observed differences were no longer significant and the results therefore need to be confirmed by further studies.
Conclusions
Our study suggests that in patients with MD who are implanted for severe to profound hearing loss the stimulation thresholds are higher during the first 2 months after cochlear implantation for the 2 most apical electrodes (1 and 2). For a deeper investigation, a study using electrical auditory brainstem responses (eABR) may be useful. The eABR can study each electrode separately and by gradually increasing the intensity of the stimulation, and can determine the threshold needed to get a response. We should thus expect firstly to get higher threshold for the apical electrodes in patients with MD, and secondly applying the same stimulation intensity obtain a greater response in non-MD patients in the same electrodes. Furthermore, as the 9th and 10th electrodes were shown to have a stationary impedance and comparative MCL over time, one of them could be used as a reference to compare the responses in the apical electrodes between patients with MD or OA. Electrocochleography can also be useful to evaluate the synapse’s response, but implies an atraumatic insertion of the CI electrodes, which is not always the case.
Conflict of interest statement
We have conflict of interest with MED-EL as their engineer reviewed the paper.
Funding
This research did not receive any specific grant from funding agencies in the public, commercial, or not-for-profit sectors.
Author contributions
AB: conceptualization, data analysing, methodology, writing; VP: reviewing, data analysing; FS: methodology; KB: reviewing; SS: reviewing; RQ: reviewing.
Ethical considerations
Informed consent for data collection in medical records was obtained from the institution through the MR004 procedure. All procedures performed in the study were in accordance with the ethical standards of the institution and with the 1964 Helsinki Declaration and its later amendments.
History
Received: September 10, 2025
Accepted: November 16, 2025
Figures and tables
Figure 1. Variation of the mean electrode impedances over time. It shows the evolution between CI activation and 12 months after cochlear implantation.
Figure 2. Mean MCL for the electrodes comparing MD and OA groups over time. The electrodes were divided into apical (E1 to E3), median (E4 to E6 and E7 to E9) and basal (E10 to E12) electrodes. The dotted lines correspond to results of the MD group whereas the continuous lines correspond to the results of the OA group.
Figure 3. MCL plot against impedance in MD and OA groups. These plots show the evolution of the MCL/impedance over time. As the MCL are lower during the first months, the lower the dots, the earlier after cochlear implantation. A MCL threshold has been drawn to show the difference in MCL/impedance ratio between the groups in the first months.
| Meniere’s disease (MD) | Other aetiologies (OA) | |
|---|---|---|
| Number of patients | 21 | 197 |
| Mean age | 66.1 | 63.8 |
| (SD = 9.9) | (SD = 15) | |
| Sex (n) | ||
| Male | 8 | 108 |
| Female | 13 | 89 |
| Side of the CI (n) | ||
| Right | 12 | 101 |
| Left | 9 | 96 |
| SD: standard deviation. | ||
| Speech recognition | MD | OA | p value(M-W) | ||
|---|---|---|---|---|---|
| Mean | SD | Mean | SD | ||
| Monosyllabic CI | 57 | 24 | 46 | 27 | 0.09 |
| (n) | (15) | (118) | |||
| Monosyllabic CI + HA | 67 | 29 | 64 | 23 | 0.35 |
| (n) | (13) | (96) | |||
| Disyllabic CI | 52 | 31 | 41 | 30 | 0.25 |
| (n) | (13) | (87) | |||
| Disyllabic CI + HA | 74 | 31 | 64 | 31 | 0.24 |
| (n) | (10) | (79) | |||
| CI: cochlear implant; HA: hearing aids; SD: standard deviation; M-W: Mann and Whitney test.. | |||||
| Electrode | 1 month | 2 months | 3 months | 6 months | 12 months | ||||||||||
|---|---|---|---|---|---|---|---|---|---|---|---|---|---|---|---|
| MD(SD) | OA(SD) | p value(M-W) | MD(SD) | OA(SD) | p value(M-W) | MD(SD) | OA(SD) | p value(M-W) | MD(SD) | OA(SD) | p value(M-W) | MD(SD) | OA(SD) | p value(M-W) | |
| 1 | 8.71(2.9) | 8.78(2.8) | 1 | 8.41(2.8) | 8.17(2.8) | 1 | 7.98(2.9) | 7.83(3) | 1 | 7.44(3.1) | 7.26(2.7) | 1 | 7.01(3.9) | 7.76(3) | 1 |
| 2 | 7.97(1.7) | 8.32(2.7) | 1 | 7.61(2.1) | 7.76(2.6) | 1 | 7.44(1.9) | 7.42(2.9) | 1 | 6.7(2.3) | 6.73(2.5) | 1 | 6.46(2.8) | 6.82(2.9) | 1 |
| 3 | 7.33(1.7) | 7.49(2.2) | 1 | 7.01(2) | 6.76(2) | 1 | 6.86(2.2) | 6.44(2.2) | 1 | 6.48(2.5) | 6.13(2.3) | 1 | 5.81(3) | 6.63(2.3) | 0.75 |
| 4 | 6.91(1.7) | 6.87(2) | 1 | 6.71(1.3) | 6.29(1.9) | 0.7 | 6.12(1.2) | 5.86(2) | 1 | 5.66(1.3) | 5.67(2.2) | 1 | 5.39(1.5) | 5.76(2.2) | 0.85 |
| 5 | 6.67(1.4) | 6.53(1.8) | 1 | 6.41(0.9) | 5.7(1.9) | 0.041 | 5.84(1.2) | 5.41(1.9) | 0.3 | 5.71(1) | 5.14(2) | 0.08 | 5.01(1.2) | 5.56(2) | 0.15 |
| 6 | 5.54(1) | 5.53(1.3) | 1 | 4.85(1) | 5.05(1.3) | 1 | 4.9(1.1) | 4.77(1.4) | 1 | 4.72(1.3) | 4.58(1.4) | 1 | 4.44(1.4) | 4.76(1.5) | 1 |
| 7 | 5.65(0.9) | 5.59(1.6) | 1 | 5.32(1.1) | 5.08(1.4) | 1 | 5.14(1.3) | 4.92(1.6) | 1 | 4.91(1.2) | 4.69(1.6) | 1 | 4.59(1.6) | 4.83(1.7) | 1 |
| 8 | 5.75(1.1) | 5.44(1.2) | 1 | 5.26(1.3) | 5.12(1.4) | 1 | 5.37(1.5) | 5.01(1.5) | 1 | 5.24(1.7) | 4.9(1.7) | 1 | 4.86(1.8) | 5.34(2) | 0.71 |
| 9 | 5.93(0.8) | 5.51(1.2) | 0.6 | 5.71(1.2) | 5.38(1.4) | 1 | 5.84(1.2) | 5.5(1.6) | 1 | 6.3(1.4) | 5.35(1.9) | 0.0351 | 5.42(1.4) | 5.98(2.1) | 0.31 |
| 10 | 6.08(0.9) | 5.65(1.4) | 0.5 | 5.91(1.4) | 5.72(1.5) | 1 | 6.45(1.6) | 5.74(1.6) | 0.35 | 6.74(1.7) | 5.86(1.8) | 0.26 | 6.03(2) | 6.83(2.1) | 0.49 |
| 11 | 5.9(1.2) | 5.68(1.5) | 1 | 5.61(1.9) | 5.69(1.7) | 1 | 6.11(1.8) | 6(1.7) | 1 | 6.8(2.4) | 6.28(2.1) | 1 | 6.65(2.9) | 7.3(2.5) | 1 |
| 12 | 5.86(1.3) | 5.86(1.5) | 1 | 5.45(1.4) | 5.85(1.6) | 1 | 6.09(2) | 6.29(1.8) | 1 | 7.07(2.3) | 6.71(2.3) | 1 | 7.14(3) | 8.17(2.6) | 0.96 |
| 1 significant p value; SD: standard deviation; M-W: Mann and Whitney test. | |||||||||||||||
| Electrode | 1 month | 2 months | 3 months | 6 months | 12 months | ||||
|---|---|---|---|---|---|---|---|---|---|
| Z(SD) | Z(SD) | p value(M-W) | Z(SD) | p value(M-W) | Z(SD) | p value(M-W) | Z(SD) | p value(M-W) | |
| 1 | 8.77 (2.8) | 8.19 (2.8) | 0.16 | 7.85(3) | 0.0041 | 7.28 (2.8) | 1.7e-061 | 7.1 (3.2) | 2.3e-081 |
| 2 | 8.27 (2.6) | 7.74 (2.6) | 0.08 | 7.42 (2.8) | 0.0081 | 6.73 (2.5) | 2.0e-081 | 6.5 (2.9) | 1.6e-111 |
| 3 | 7.47 (2.1) | 6.79(2) | 0.0041 | 6.5 (2.2) | 1.3e-041 | 6.17 (2.3) | 8.1e-081 | 5.91 (2.4) | 6.4e-121 |
| 4 | 6.88(2) | 6.34 (1.9) | 0.0361 | 5.9 (1.9) | 2.5e-051 | 5.67 (2.1) | 3.5e-081 | 5.43 (2.1) | 2.3e-111 |
| 5 | 6.55 (1.8) | 5.78 (1.8) | 2.5e-051 | 5.47 (1.8) | 1.7e-081 | 5.21(2) | 3.9e-131 | 5.07 (1.9) | 6.3e-151 |
| 6 | 5.53 (1.3) | 5.03 (1.3) | 1.4e-041 | 4.79 (1.3) | 1.2e-071 | 4.59 (1.4) | 5.3e-121 | 4.48 (1.5) | 1.7e-131 |
| 7 | 5.6 (1.5) | 5.11 (1.4) | 0.0031 | 4.95 (1.5) | 3.5e-051 | 4.71 (1.6) | 6.4e-091 | 4.62 (1.7) | 7.5e-111 |
| 8 | 5.48 (1.2) | 5.14 (1.4) | 0.0161 | 5.06 (1.5) | 0.0041 | 4.94 (1.7) | 2.7e-051 | 4.91(2) | 3.2e-061 |
| 9 | 5.56 (1.2) | 5.42 (1.4) | 0.52 | 5.55 (1.6) | 1 | 5.46 (1.8) | 0.16 | 5.48(2) | 0.12 |
| 10 | 5.7 (1.4) | 5.74 (1.5) | 1 | 5.84 (1.6) | 1 | 5.97 (1.8) | 1 | 6.12 (2.1) | 0.88 |
| 11 | 5.7 (1.4) | 5.68 (1.7) | 1 | 6.02 (1.7) | 0.32 | 6.34 (2.1) | 0.0121 | 6.72 (2.6) | 0.00041 |
| 12 | 5.86 (1.5) | 5.8 (1.6) | 1 | 6.26 (1.8) | 0.08 | 6.86 (2.3) | 4.0e-051 | 7.26 (2.7) | 9.3e-071 |
| SD: standard deviation; M-W: Mann and Whitney test. | |||||||||
| Electrode | 1 month | 2 months | 3 months | 6 months | 12 months | ||||||||||
|---|---|---|---|---|---|---|---|---|---|---|---|---|---|---|---|
| MD(SD) | OA(SD) | p value(M-W) | MD(SD) | OA(SD) | p value(M-W) | MD(SD) | OA(SD) | p value(M-W) | MD(SD) | OA(SD) | p value(M-W) | MD(SD) | OA(SD) | p-value(M-W) | |
| 1 | 15(4.5) | 12.98(5.1) | 0.011 | 18.07(6.5) | 14.48(6.1) | 0.0061 | 18.34(7.9) | 16.13(6.5) | 0.26 | 20.02(12.7) | 18.15(8.5) | 0.86 | 18.96(9.9) | 18.33(8.3) | 0.77 |
| 2 | 14.47(5) | 12.41(4.1) | 0.041 | 16.99(6.1) | 14.14(6.2) | 0.011 | 17.46(7.6) | 16.05(6.4) | 0.50 | 19.32(12.1) | 17.87(8.2) | 0.90 | 18.57(8.9) | 18.47(8.4) | 0.85 |
| 3 | 13.67(6) | 12.27(4) | 0.15 | 16.68(6) | 14.13(5.9) | 0.0481 | 17.58(8.1) | 15.89(6) | 0.56 | 19.31(11.5) | 17.98(8) | 0.81 | 18.61(8.3) | 18.63(8.2) | 0.89 |
| 4 | 14.38(9.6) | 12.03(4.3) | 0.24 | 16.53(6.5) | 14.2(6) | 0.12 | 17.78(8.9) | 16.21(6.1) | 0.88 | 19.08(11.6) | 18.23(8.5) | 0.81 | 18.41(8.7) | 19.01(8.7) | 0.84 |
| 5 | 15.26(8.7) | 13.41(5.4) | 0.26 | 17.8(6.7) | 15.46(6.1) | 0.15 | 18.92(9.2) | 17.55(6.3) | 0.95 | 19.93(9.4) | 20.01(9) | 0.74 | 19.95(8.7) | 21.67(9.3) | 0.75 |
| 6 | 15.88(9.1) | 14.08(5.3) | 0.37 | 17.81(6.5) | 16.26(6.6) | 0.35 | 19.25(9.4) | 18.42(6.7) | 0.84 | 20.11(9.5) | 20.74(8.8) | 0.46 | 20.52(9.1) | 21.69(9.5) | 0.59 |
| 7 | 16.77(9.9) | 14.83(5.5) | 0.31 | 18.05(5) | 17.13(7.2) | 0.16 | 19.5(8.9) | 18.99(6.9) | 0.81 | 20.41(9.3) | 21.18(8.7) | 0.46 | 20.74(9.2) | 21.76(9.3) | 0.56 |
| 8 | 16.64(9.1) | 15.59(5.5) | 0.78 | 17.76(4.8) | 17.78(6.8) | 0.62 | 19.46(8.7) | 19.13(6.7) | 0.64 | 20.27(9.3) | 21.43(8.3) | 0.27 | 20.39(9.1) | 21.92(8.8) | 0.32 |
| 9 | 16.68(8.6) | 15.88(6.3) | 0.56 | 17.07(5.2) | 17.68(6.1) | 0.94 | 18.69(8.7) | 19.08(6.7) | 0.48 | 20(9.2) | 21.35(8.6) | 0.21 | 20.89(9.5) | 21.51(8.5) | 0.46 |
| 10 | 14.54(3.1) | 15.34(5.7) | 0.85 | 16.74(3.9) | 17.07(6.2) | 0.66 | 17.16(5) | 18.55(6.5) | 0.44 | 17.94(5) | 20.54(8.8) | 0.31 | 20.93(9.3) | 20.93(8.7) | 0.91 |
| 11 | 15.57(7.5) | 15.35(5.8) | 0.85 | 17.37(6.6) | 16.42(5.7) | 0.70 | 17.14(5.9) | 17.88(6.2) | 0.53 | 17.98(6) | 19.47(7.5) | 0.50 | 20.36(10.3) | 20.05(7.8) | 0.57 |
| 12 | 18.04(13.8) | 16.14(6.2) | 0.92 | 19.24(9.9) | 16.81(5.6) | 0.46 | 18.46(9.3) | 18.19(6.4) | 0.58 | 19.33(9.1) | 18.82(6.8) | 0.83 | 21.75(13.3) | 19.57(7.1) | 0.99 |
| 1 significant p value; SD: standard deviation; M-W: Mann and Whitney test. | |||||||||||||||
References
- Lopez-Escamez J, Carey J, Chung W. Diagnostic criteria for Menière’s disease. J Vestib Res Equilib Orientat. 2015;25:1-7. doi:https://doi.org/10.3233/VES-150549
- Devantier L, Callesen H, Hougaard D. A systematic review and meta-analysis of intratympanic gentamicin for patients with Ménières disease. Acta Otolaryngol (Stockh). 2025;145:669-675. doi:https://doi.org/10.1080/00016489.2025.2504033
- Sajjadi H, Paparella M. Meniere’s disease. Lancet Lond Engl. 2008;372:406-414. doi:https://doi.org/10.1016/S0140-6736(08)61161-7
- McNeill C, McMahon C, Newall P. Hearing aids for Ménière’s syndrome: implications of hearing fluctuation. J Am Acad Audiol. 2008;19:430-434. doi:https://doi.org/10.3766/jaaa.19.5.5
- McNeill C, Eykamp K. Cochlear implant impedance fluctuation in Ménière’s disease: a case study. Otol Neurotol. 2016;37:873-877. doi:https://doi.org/10.1097/MAO.0000000000001061
- Prenzler N, Bültmann E, Giourgas A. Cochlear implantation in patients with definite Meniere’s disease. Eur Arch Otorhinolaryngol. 2017;274:751-756. doi:https://doi.org/10.1007/s00405-016-4356-z
- Desiato V, Patel J, Nguyen S. Cochlear implantation in patients with Meniere’s disease: a systematic review. World J Otorhinolaryngol. 2021;7:303-311. doi:https://doi.org/10.1016/j.wjorl.2020.03.004
- Chien C, Kulthaveesup A, Herrmann B. Cochlear implantation hearing outcome in Ménière’s disease. Otolaryngol Head Neck Surg. 2022;166:523-529. doi:https://doi.org/10.1177/01945998211012298
- Villavisanis D, Mavrommatis M, Berson E. Cochlear implantation in Meniere’s disease: a systematic review and meta-analysis. Laryngoscope. 2021;131:1845-1854. doi:https://doi.org/10.1002/lary.29393
- Samy R, Houston L, Scott M. Cochlear implantation in patients with Meniere’s disease. Cochlear Implants Int. 2015;16:208-212. doi:https://doi.org/10.1179/1754762814Y.0000000104
- Degen C, Büchner A, Kludt E. Effect of electrode to modiolus distance on electrophysiological and psychophysical parameters in CI patients with perimodiolar and lateral electrode arrays. Otol Neurotol. 2020;41:E1091-E1097. doi:https://doi.org/10.1097/MAO.0000000000002751
- Hallin K, Schart-Morén N, Rask-Andersen H. Speech perception and hearing preservation after cochlear implantation in patients with Meniere’s disease. Acta Otolaryngol (Stockh). 2025;145:430-435. doi:https://doi.org/10.1080/14670100.2022.2112998
- van Wermeskerken G, van Olphen A, Smoorenburg G. Intra- and postoperative electrode impedance of the straight and Contour arrays of the Nucleus 24 cochlear implant: relation to T and C levels. Int J Audiol. 2006;45:537-544. doi:https://doi.org/10.1080/14992020600825466
- Espina González C, Morant Ventura A, Pla Gil I. Variation of electrical impedance over 5 years post-implantation and relationship with the maximum comfort level (MCL) in adults with cochlear implants. Acta Otorrinolaringol Esp. 2024;75:23-30. doi:https://doi.org/10.1016/j.otoeng.2024.01.004
- Alahmadi A, Abdelsamad Y, Yousef M. Cochlear implantation: long-term effect of early activation on electrode impedance. J Clin Med. 2024;13. doi:https://doi.org/10.3390/jcm13113299
- Li P, Somdas M, Eddington D. Analysis of intracochlear new bone and fibrous tissue formation in human subjects with cochlear implants. Ann Otol Rhinol Laryngol. 2007;116:731-738. doi:https://doi.org/10.1177/000348940711601004
- Yoshimura H, Watanabe K, Nishio S. Determining optimal cochlear implant electrode array with OTOPLAN. Acta Otolaryngol (Stockh). 2023;143:748-752. doi:https://doi.org/10.1080/00016489.2023.2256790
- Basura G, Adams M, Monfared A. Clinical practice guideline: Ménière’s disease. Otolaryngol Head Neck Surg. 2020;162:S1-S55. doi:https://doi.org/10.1177/0194599820909438
- Boyd P. Effects of programming threshold and maplaw settings on acoustic thresholds and speech discrimination with the MED-EL COMBI 40+ cochlear implant. Ear Hear. 2006;27:608-618. doi:https://doi.org/10.1097/01.aud.0000245815.07623.db
- Horner K. Old theme and new reflections: hearing impairment associated with endolymphatic hydrops. Hear Res. 1991;52:147-156. doi:https://doi.org/10.1016/0378-5955(91)90194-e
- Nadol J. Focal endolymphatic hydrops as seen in the pars inferior of the human inner ear. Otol Neurotol. 2016;37:859-864. doi:https://doi.org/10.1097/MAO.0000000000001094
- Pender D. Meniere’s disease: structural considerations in early cochlea hydrops. Laryngoscope Investig Otolaryngol. 2024;9. doi:https://doi.org/10.1002/lio2.70041
- Eliezer M, Attyé A, Toupet M. Imaging of endolymphatic hydrops: a comprehensive update in primary and secondary hydropic ear disease. J Vestib Res Equilib Orientat. 2021;31:261-268. doi:https://doi.org/10.3233/VES-200786
- Liberman M, Kujawa S. Cochlear synaptopathy in acquired sensorineural hearing loss: manifestations and mechanisms. Hear Res. 2017;349:138-147. doi:https://doi.org/10.1016/j.heares.2017.01.003
- Valenzuela C, Lee C, Mispagel A. Is cochlear synapse loss an origin of low-frequency hearing loss associated with endolymphatic hydrops?. Hear Res. 2020;398. doi:https://doi.org/10.1016/j.heares.2020.108099
Downloads
License

This work is licensed under a Creative Commons Attribution-NonCommercial-NoDerivatives 4.0 International License.
Copyright
Copyright (c) 2026 Società Italiana di Otorinolaringoiatria e chirurgia cervico facciale
How to Cite
- Abstract viewed - 302 times
- PDF downloaded - 83 times