Head and neck
Vol. 45: Issue 3 - June 2025
Airway assessment and management in head and neck cancer surgery
Summary
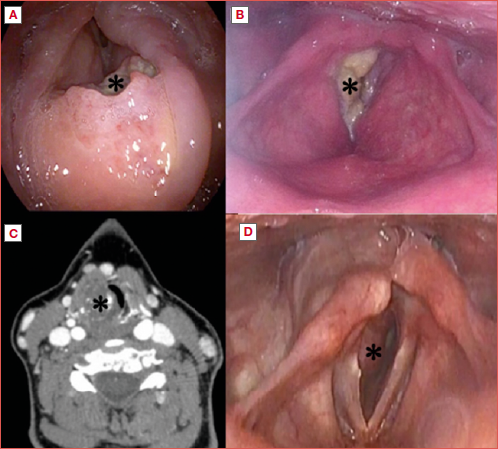
Cover Image
Objectives. Head and neck cancer surgery (HNCS) is burdened by a great risk of difficult airway and adverse events during anaesthesia. This study describes our experience and provides a flowchart for airway management in HNCS.
Methods. We retrospectively reviewed 910 surgically treated patients (January 2022-January 2023, European Institute of Oncology, Milan, Italy). We selected malignant tumours of the upper airway and surgery performed under general anaesthesia. We report a descriptive analysis of the sample. The data collected were representative of our daily clinical practice and have been used to
draw up a proposal for airway management in HNCS.
Results. 200 consecutive patients (males 71.5%, females 28.5%), median age 67 years, were selected. The most represented sites were larynx (44.5%), oral cavity (30.5%), and oropharynx (20%). Airway management was obtained by orotracheal intubation (61%), nasotracheal intubation (15%), awake intubation under fibreoptic endoscopic control (15%), and tracheostomy under local anaesthesia (9%). In 3 cases we performed tracheostomy in an emergency setting (all patients affected by laryngeal cancer in a locally advanced stage).
Conclusions. Airway management in HNCS represents a topic of compelling interest that requires careful planning, well-defined options of strategies, and close communication between anaesthesiologists and surgeons.
Introduction
Airway management is a cornerstone in the daily anaesthesiological practice, and a difficult airway represents a challenging issue 1. The most recent guidelines define a difficult airway as “the clinical situation in which anticipated or unanticipated difficulty or failure is experienced in one or more of the following: face-mask ventilation, laryngoscopy, ventilation using a supraglottic airway, tracheal intubation, extubation, or invasive airway” 2. In difficult airway management, 3 different scenarios can occur: predicted difficult airway; difficult intubation with adequate oxygenation/ventilation (“non-emergency” pathway); “emergency” pathway for difficult intubation without adequate oxygenation/ventilation (“Cannot Intubate, Cannot Oxygenate”, CICO) 3.
The incidence of difficult airway and potential CICO events is higher in patients undergoing head and neck cancer surgery (HNCS) 4 compared to a normal population undergoing surgery. The presence of an upper airway neoplasia and the sequelae from previous treatments can lead to difficult tracheal intubation and pulmonary ventilation. The difficult intubation rate is estimated to be 12.3% in HNCS, 3.5% in non-oncological otolaryngology surgery, and 2% in general surgery 4. The Royal College of Anaesthetists reported a one-year audit about the incidence of major complications of airway management: out of 133 major airway-related events in the perioperative period, 57 (43%) were associated with HNCS; of the 58 surgical cases where a CICO scenario occurred, 43 (74%) were in HNCS 5.
Therefore, preoperative detection of patients who are at risk for difficult intubation is the first step in airway management 6. Airway assessment should be routinely performed to identify risk factors that might lead to choose devices such as face-mask ventilation instead of supraglottic device insertion (laryngeal mask), tracheal intubation, or front-of-neck access 3. Failure to thoroughly assess the airway and accurately anticipate difficulties is widely recognised as the most important factor leading to major complications 6. These unexpected complications occur especially in HNCS where the pre-anaesthesia visit plays a pivotal role in prediction of difficult airway. All this background results in necessity of a multidisciplinary team where different knowledges are shared: evaluation of general anaesthesiologic criteria (mouth opening, Mallampati score, thyromental distance, range of neck motions, neck circumference, upper jaw dental status, etc.) 2,3,6, as well as the characteristics of the head and neck pathologies, with their implications and type of surgical interventions. Critical cases should always be shared between the anaesthesiologists and head and neck surgeons to estimate the risk of critical intubation and schedule the safest intubation strategy. In this context, the collaboration between anaesthesiologists and head and neck surgeons is mandatory and permits the reduction of adverse events.
Difficult airway guidelines provide algorithms for the assessment and management of the difficult airway, but do not specifically address airway management in HNCS 2,3,7. Intubation of patients with head and neck cancer can be particularly challenging due to the cancer’s site of origin in the upper airway and for the variety of surgical procedures adopted. To the best of our knowledge, there are no currently available guidelines that specifically address difficult airway management in HNCS, and nowadays risk assessment is mainly based on clinical experience. Herein, we describe our daily experience as a tertiary cancer care centre and provide a proposal for practical management of difficult airway in HNCS.
Materials and methods
The study was approved by Institutional Review Board and written informed consent was obtained from all subjects.
We retrospectively reviewed the clinical records of 910 patients from our Institutional database submitted to a surgical procedure in the Division of Otolaryngology & Head and Neck Surgery of IRCCS European Institute of Oncology from January 2022 to January 2023.
The inclusion criteria were: 1) diagnosis of head and neck cancer; 2) neoplasia involving the upper airway; 3) surgery performed under general anaesthesia; 4) elective surgery; 5) age ≥ 18 years. Exclusion criteria were: 1) malignant tumour of head and neck not directly involving the upper airway (e.g. thyroid or salivary gland carcinoma); 2) non-malignant histology; 3) precancerous lesions; 4) patients in whom tracheostomy had been already performed and tracheal cannula was still in place; 5) surgery performed under local anaesthesia; 6) tracheal stenosis. Data collected included patient demographics and clinical history, tumour characteristics (site and subsite, histology, stage), type of surgical procedure, type of airway management (orotracheal/nasotracheal intubation; awake intubation with fibrescope, managed with sedation in spontaneous ventilation; tracheostomy under local anaesthesia) and adverse events during intubation.
Preoperative evaluation
All patients referred to elective surgery under general anaesthesia underwent a preoperative assessment about 2 weeks before surgery. The preoperative assessment includes routine blood tests, chest X-rays, cardiological, otolaryngological and, finally, anaesthesiologic evaluations. During head and neck evaluation, the patient undergoes a pharyngo-laryngeal endoscopy to assess the tumour’s characteristics and airway patency. The video-endoscopy is always recorded and, later, shared and discussed with the anaesthesiologists to schedule safe airway management for each patient. During the examination, different potential critical points for airway management are evaluated.
Nasal cavity and nasopharynx:
- patency of nasal fossa and nasopharynx;
- most suitable nasal fossa in case of nasotracheal intubation.
Oropharynx and parapharyngeal space:
- bulky masses;
- risk of bleeding.
Larynx:
- bulky/collapsing masses;
- risk of bleeding;
- arytenoid mobility;
- glottic and subglottic space.
In particular, the otolaryngologist must identify any masses or changes in the upper airways that may prevent ventilation after induction of narcosis.
All the data collected were studied and used to propose an algorithm for management of difficult airway in HNCS.
Results
Based on inclusion and exclusion criteria, we included 200 consecutive patients of 910. Clinical and demographic characteristics are summarised in Tables I-III. The sample was considered representative of our daily surgical practice since the distribution of the affected sites and adopted surgery match with the annual report of patients admitted and treated in our Department.
The sample included 143 males (71.5%) and 57 females (28.5%). The median age was 67 years (interquartile range [IQR], 60-75). About one-third (38.5%) had already received head and neck cancer treatments before the index surgical procedure. The vast majority of tumours were squamous cell carcinoma (SCC) (185/200; 92.5%) and early and advanced stages were equally represented. At preoperative fibreoptic evaluation, 53 cases showed reduced respiratory space (oropharyngeal or laryngeal). Despite this, all patients but 3 were eupneic ahead of surgery. One hundred twenty-two patients (61%) underwent orotracheal intubation, with Macintosh laryngoscope or with the help of GlideScope®, based on the anaesthesiological preference and skills. Nasotracheal intubation was performed in 30 cases (15%), mainly required for oral cavity surgery. Awake intubation under endoscopic control was previously scheduled and performed in 30 cases (15%) due to peculiar patient characteristics (e.g. trismus, previous radiotherapy). Eighteen patients (9%) required a tracheostomy under local anaesthesia due to inaccessible supraglottic airways. Three cases (3/18) underwent a tracheostomy in an emergency setting due to an unexpected CICO event (Tab. IV). All 3 patients were affected by laryngeal cancer in a locally advanced stage (T3-T4a), and all had a body mass index (BMI) above normal values (2 overweight and one obese; BMI of 27, 28, and 39 kg/m2, respectively). We did not foresee these critical events due to the average standard parameters of the patients (Mallampati, mouth opening, thyro-mental distance, neck mobility) and probably to underestimation of preoperative video-endoscopy as well. All emergency tracheostomies were uncomplicated, and all patients were then submitted to the scheduled surgery. Furthermore, in 80 patients (40%) we planned and performed a tracheostomy during the surgical procedure for postoperative airway protection, which was especially required in major oral cavity surgeries with flap reconstruction and open partial laryngectomies.
Discussion
The difficult airway represents a complex interaction between patient factors, clinical setting, and skills of the practitioner 8. A pre-induction strategy that considers various interventions designed to facilitate intubation should be preplanned when a difficult airway is expected (i.e. adequate patient position, optimal preoxygenation, assessment of aspiration’s risk and mechanical drainage by nasogastric tube and use of device as GlideScope®) 3,9. Airway management is safest when potential problems are identified before surgery, enabling the adoption of a series of plans to reduce the risk of complications 3,5. As recommended in practice guidelines for difficult airway management, there is a need for “preformulated strategy for management of the anticipated difficult airway, which will depend in part on the anticipated surgery, condition of the patient, patient cooperation/consent, age, skills and preference of anaesthesiologist” 2.
Emphasis should be placed on assessment, preparation, positioning, preoxygenation, maintenance of oxygenation, and minimising trauma from airway interventions, especially in the case of ulcerated lesions 2,3,7.
Every attempt at laryngoscopy and tracheal intubation might lead to unnecessary mucosal trauma and tumour bleeding in lesions at risk. It is recommended that the number of airway intubation attempts is limited, and blind techniques using a bougie or laryngeal mask have been superseded by fibre-optically guided intubation 2,3,7. When tracheal intubation and supraglottic airway device insertion have failed but ventilation is acceptable, the indication is waking the patient 3. At this stage, if face-mask oxygenation is not feasible due to the presence of muscle relaxation and upper airway obstruction, an emergency surgical airway must be established immediately 3. In this setting, the surgical options include a cricothyroidotomy or a tracheostomy 10. Emergency unplanned tracheostomies are usually poorly controlled procedures that should be avoided whenever possible 11. Head and neck malignancy, especially in case of bleeding risk during intubation, is the most common indication for an awake tracheostomy (reported rates varying widely among studies, from 0.3% to 46%) 12-14. In our experience, awake tracheostomy should also be considered in the case of bulky masses of the pharyngo-laryngeal tract that could potentially collapse and prevent ventilation after induction of narcosis. Emergency awake tracheostomy is associated with a 6.2-fold higher risk of pneumothorax and pneumomediastinum 15. Deaths related to emergency tracheostomy represent rare events (reported rates of 0.2%) 16.
These considerations are well known in anaesthesiological practice and are described in detail in the most recent guidelines for assessment and management of the airway 2,3,7,17.
Improvement in difficult airway management proposed in recent years relies principally on anaesthesiologist technical points 18: optimised mask ventilation, appropriate intubation tools, aid of device improving laryngeal inlet visualisation (GlideScope® and other similar videolaryngoscopic tools), and maximisation of the safe apnoea oxygenation time such as in transnasal humidified rapid insufflation ventilatory exchange (THRIVE) 9,19. However, to our knowledge, no specific airway management algorithm exists for patients undergoing HNCS. As previously mentioned, in HNCS the incidence of difficult airway and CICO events are more frequent than in other surgeries 4. Risk factors that must be considered in HNCS are: 1) previous radiotherapy that affects tissue elasticity and impacts mouth opening, neck mobility and mucosal oedema; 2) supraglottic lesions that may obstruct the laryngeal lumen; 3) reduced glottis and subglottic space 20.
We report descriptive data on 200 patients submitted to HNCS, which is representative of daily clinical practice in an oncology referral hospital. Most of our patients did not complain of subjective dyspnoea (97%), even if we detected an alteration of the respiratory space during clinical assessment with fiberoptic endoscopy (26.5%). This examination is fundamental in preoperative assessment: Rosenblatt and colleagues reported revision of airway management plans in 26% of patients based on preoperative fiberoptic endoscopy 21.
Most patients were submitted to orotracheal intubation after induction (53%). Nasotracheal intubation was performed in asleep and awake patients under endoscopic view in 17% and 18% of cases, respectively. Nasotracheal intubation was frequently required for oral cavity or oropharyngeal surgery due to the risk of trauma and bleeding of the lesion. As expected, and in line with other studies, patients with laryngeal cancer present a higher risk of difficult airway management (Cover figure) and need even stricter collaboration between the surgeon and ansesthesiologist 11. Eissner and colleagues reported that patients with advanced laryngeal tumours showed an almost 6-fold higher risk for unplanned tracheostomy than patients with an early-stage oropharyngeal carcinoma 11.
In our case series 3 CICO events occurred (1.5%), and all patients had loco-regional advanced laryngeal cancer. The “failure” of the strategy observed in these 3 critical cases prompted us to draw up decision-making flowcharts for HNCS to prevent similar situations from recurring.
Based on our data and clinical experience, we propose a flowchart for the difficult airway management in HNCS, divided into anatomical sites: larynx (Fig. 1A), oral cavity (Fig. 1B), oropharynx (Fig. 1C), parapharyngeal space (Fig. 1D), and nose and paranasal sinuses (Fig. 1E). When not specified, the choice between intubation after induction and awake intubation (sedated procedure) is made by the anaesthesiologists depending on general preoperative parameters (Mallampati score, thyromental distance, mouth opening or inter-incisor gap, BMI > 30 kg/m2, micrognathia, previous radiotherapy, and cervical extension) and other factors reported in the difficult airway algorithm previously reported 2,3. Our proposal can also be applied in cases of benign upper airway tumours. More specifically, voluminous or flapping benign lesions of the upper airway can represent challenging cases as well. Our proposal does not apply to head and neck traumatology.
In case of supraglottic lesions, anaesthesiologists must always consider the risks of airway collapse and obstruction during induction to general anaesthesia.
A tube for microlaryngoscopy is frequently used in laryngeal surgery because of its small internal diameter (4-6 mm) while maintaining a standard adult tube length and cuff volume. A laser-safe tube with 2 cuffs (i.e. Laser-flexTM, Covidien) should be considered in laryngeal surgeries involving the laser to prevent balloon damage and airway fire 22.
In glottic tumours with reduced respiratory space, awake intubation with a fibrescope is not recommended due to the risk of laryngospasm and adverse events. In these cases, we recommend using smaller tubes, possibly with the help of devices such as the GlideScope®, which provides an improved view of the larynx and image sharing with colleagues 9. In selected cases of laryngo-tracheal surgery a flow-controlled ventilation system with a narrow-cuffed catheter can also be used 23. If none of these procedures are feasible, a scheduled tracheostomy under local anaesthesia and sedation is required. A low threshold for tracheotomy under local anaesthesia should be always maintained in case of patients requiring an open neck laryngeal surgery for advanced tumours, especially when total laryngectomy and permanent stoma have been planned.
Another potentially challenging case is represented by cricoid chondrosarcoma (Cover figure), a rare disease, which determines a progressive subglottic stenosis, often with mild symptoms (normal voice and no apparent signs of dyspnoea), because of the typically slow progression 24. In these situations, computed tomography (CT) is fundamental to evaluate the respiratory subglottic space. We recommend that a tracheostomy under local anaesthesia be performed, because of the impossibility of displacing the hard submucosal lesion with a trans-glottic tube. In such a case it is fundamental to choose the right level (crico-tracheal membrane versus first tracheal rings) to perform it, according to the type of resection planned for the lesion itself (crico-tracheal resection and anastomosis versus laser resection or other) 25,26.
In the oral cavity, the choice of intubation is mainly guided by the tumour site and the type of surgery. In the case of previous radiotherapy, awake nasal intubation with fibrescope should always be considered.
Laryngoscopy should be avoided in case of lesions of the tongue base at risk of bleeding (Fig. 2), because of the possibility of trauma and haemorrhage. In these situations, we always recommend an awake intubation with fibrescope. Voluminous submucosal lesions of the parapharyngeal space can be particularly challenging (Fig. 3).
The different cut-off we have chosen in the flow diagrams (e.g. 50%) is mainly based on our clinical experience and is voluntarily simplistic: the tumour is obviously a 3D structure and is difficult to measure precisely. We think that this type of description (percentage of airway obstruction) might be more understandable and applicable in this context.
Table V summarises the different types of airway management in HNCS.
In the last decade, only some authors have dealt with this argument from different points of view, and only 3 papers report results from their case series. Iseli et al. prospectively recorded 152 cases of difficult airway: predictors of failure included cancer diagnosis, previous radiotherapy and supraglottic lesions 20. Nagarkar et al. retrospectively studied 500 patients (from 2008 to 2013; laryngeal cancer excluded) intending to describe the different modalities of airway management, observe the effect of different techniques on postoperative length of hospital stay, and calculate the incidence of emergency tracheostomy 27. They concluded that fibreoptic nasotracheal intubation is the preferred technique in managing a difficult airway in HNCS. Hyman and colleagues performed a prospective observational study to define the grade and quality of the view obtained with videolaryngoscopy in 100 patients deemed at higher risk of difficult intubation and preselected to undergo awake or sedated fibreoptic intubation 28. In one-third of patients, no view was possible with videolaryngoscopy, whereas fibreoptic intubation was successful in 99% of cases 28.
Other authors principally describe different strategies available in airway management for HNCS with pros and cons, but do not specify which option is preferable considering the tumour characteristics and type of surgery 10,22,29. Sagiv et al. published a retrospective review on awake tracheostomy: the most common indication was head and neck malignancy, with the larynx being the most involved site (53.8%) 12. Most of these papers conclude that preoperative endoscopic airway examination is mandatory, an effective teamwork between the surgeon and anaesthesiologist is emphasised and stresses the need for a backup plan.
To our knowledge, this is the first report about airway management in HNCS with case series description and flowchart proposal that is potentially applicable to daily clinical practice. We are aware that our case series is limited and needs to be expanded to define specific evidence-based algorithms and guidelines. Nonetheless, this proposal could be the first step towards the definition of a standardised approach to difficult airway management in HNCS. Further studies in a multicentric setting with prospective application of our proposal will be needed to validate our flowcharts.
Conclusions
In conclusion, difficult airway management in HNCS represents a topic of compelling interest that requires careful planning, defined options of strategies and close communication between anaesthesiologists and head and neck surgeons. Our simple and practical flowcharts may be a potentially useful tool in such delicate clinical scenarios.
Conflict of interest statement
The authors declare no conflict of interest.
Funding
The authors certify that there is no conflict of interest with any financial organization regarding the material discussed in the manuscript. The European Institute of Oncology was partially supported by the Italian Ministry of Health with Progetto di Eccellenza, Ricerca Corrente and 5x1000 funds.
Author contributions
MA, MV: conception and design of the manuscript; CM, GP: manuscript writing and design; ET, FC: acquisition, analysis and interpretation of the data; DS, SZ, MT: critical revision of the manuscript. All authors read and approved the final version of the manuscript.
Ethical consideration
This study was approved by the Institutional Ethics Committee (Istituto Europeo di Oncologia, protocol number UID 4493). The research was conducted ethically, with all study procedures being performed in accordance with the requirements of the World Medical Association’s Declaration of Helsinki. Written informed consent was obtained from each participant/patient for study participation and data publication.
History
Received: October 25, 2024
Accepted: January 13, 2025
Figures and tables
Figure 1. Flowchart of airway management for laryngeal tumour (A), oral cavity tumour (B), oropharyngeal tumour (C), parapharyngeal tumour (D), and nasal/paranasal sinus tumour (E).
Figure 2. Example of tongue-base ulcerated carcinoma. B: base of tongue; V: vallecula; E: epiglottis; *: ulcerated carcinoma.
Figure 3. Example of voluminous parapharyngeal mass (*): carcinoma ex pleomorphic adenoma with evident obstruction of the respiratory space. A) clinical transoral evaluation; B) axial magnetic resonance imaging T1 sequence with contrast enhancement.
| Population study (n = 200) | |
|---|---|
| Age | |
| Median | 67 |
| Range | 20-93 |
| Interquartile Range (IQR) | 60-75 |
| Gender | |
| Male | 143 (71.5%) |
| Female | 57 (28.5%) |
| BMI (kg/m 2 ) | |
| Underweight (< 18.5) | 8 (4%) |
| Normal weight (18.5-24.9) | 89 (44.5%) |
| Overweight (25-29.9) | 74 (37%) |
| Obese (≥ 30) | 29 (14.5%) |
| Previous head & neck treatment | 77 (38.5%) |
| Surgery | 43 (21.5%) |
| Radiotherapy | 11 (5.5%) |
| Surgery + radiotherapy | 23 (11.5%) |
| Histology | |
| Squamous cell carcinoma | 185 (92.5%) |
| Salivary carcinoma | 6 (3%) |
| Lymphoproliferative disorder | 3 (1.5%) |
| Other | 6 (3%) |
| pT (TNM 8th ed.) | |
| Tis | 3 (1.5%) |
| T1 | 64 (32%) |
| T2 | 34 (17%) |
| T3 | 39 (19.5%) |
| T4 | 45 (22.5%) |
| Not classificable* | 15 (7.5%) |
| *Not classificable because of other histology (different from SCC). | |
| Tumour site and type of surgery | |
|---|---|
| Larynx and hypopharynx | 96 (48%) |
| Glottis | 68 |
| Supraglottis | 20 |
| Piriform sinus | 7 |
| Subglottis | 1 |
| Transoral laser microsurgery | 49 |
| Total laryngectomy | 19 |
| Open partial horizontal laryngectomy | 17 |
| Transoral robotic surgery | 2 |
| Other | 9 |
| Oral cavity | 61 (30.5%) |
| Tongue | 32 |
| Mandible | 9 |
| Hard palate | 6 |
| Cheek mucosa | 5 |
| Oral floor | 5 |
| Retromolar area | 3 |
| Lip | 1 |
| Major surgery with flap | 30 |
| Transoral | 21 |
| Oropharynx and parapharyngeal space | 42 (21%) |
| Base of tongue | 23 |
| Palatine tonsil | 14 |
| Posterior wall | 3 |
| Parapharyngeal space | 2 |
| Robotic surgery | 20 |
| Transoral (not robotic) | 12 |
| Major surgery with flap | 10 |
| Nose and paranasal sinuses | 1 (0.5%) |
| Clinical implications on upper airway | |
|---|---|
| Subjective dyspnoea | |
| No | 196 (98%) |
| Yes | 4 (2%) |
| Respiratory space | |
| Normal | 147 (73.5%) |
| Altered | 53 (26.5%) |
| Laryngeal | 33 |
| Oropharyngeal | 20 |
| Risk of bleeding | |
| No | 153 (76.5%) |
| Yes | 47 (23.5%) |
| Airway management | |
| Orotracheal intubation | 122 (61%) |
| Nasotracheal intubation | 30 (15%) |
| Awake intubation with fibrescope | 30 (15%) |
| Tracheostomy in local anaesthesia | 18 (9%) |
| Scheduled | 15 |
| Emergency (CICO* events) | 3 |
| *CICO: “Cannot Intubate, Cannot Oxygenate”. | |
| CICO events | Age | BMI | Mallampati score | Previous treatment | Type of tumour | Type of surgery | Scheduled airway management | CICO management |
|---|---|---|---|---|---|---|---|---|
| 1 | 61 | 28 | 1 | No | Laryngeal glottic SCC T4a | Open partial horizontal laryngectomy + neck dissection | Orotracheal intubation | Emergency tracheostomy |
| 2 | 68 | 39 | 2 | No | Laryngeal supraglottic SCC T3 | Total laryngectomy + neck dissection | Awake intubation with fibrescope | Emergency tracheostomy for laryngospasm |
| 3 | 67 | 27 | 2 | No | Laryngeal glottic SCC T3 | Total laryngectomy + neck dissection | Orotracheal intubation | Emergency tracheostomy |
| Airway management | Head and neck cancer/surgery |
|---|---|
| Orotracheal | Laryngeal cancer not obstructing the airway and without risk of bleeding |
| Oropharyngeal/parapharyngeal cancer | |
| Nose and paranasal sinuses cancer | |
| Hard palate cancer | |
| Nasotracheal | Preferable in all oral cavity cancer (except for hard palate) |
| Nasotracheal awake with fiberscope | Obstructing tumour occupying pharyngeal/supraglottic airway |
| Ulcerated lesion of the base of tongue (to avoid trauma during laryngoscopy) | |
| Consider in all cases of trismus/previous radiotherapy | |
| Tracheostomy under local anaesthesia | Obstructing/ulcerated laryngeal cancer (especially supraglottic cases) |
| Cricoid chondrosarcoma | |
| Obstructing oropharyngeal/parapharyngeal cancer |
References
- Heidegger T. Management of the difficult airway. N Engl J Med. 2021;384:1836-1847. doi:https://doi.org/10.1056/NEJMra1916801
- Apfelbaum J, Hagberg C, Connis R. 2022 American Society of Anesthesiologists practice guidelines for management of the difficult airway. Anesthesiology. 2022;136:31-81. doi:https://doi.org/10.1097/ALN.0000000000004002
- Frerk C, Mitchell V, McNarry A. Difficult Airway Society intubation guidelines working group. Difficult Airway Society 2015 guidelines for management of unanticipated difficult intubation in adults. Br J Anaesth. 2015;115:827-848. doi:https://doi.org/10.1093/bja/aev371
- Arné J, Descoins P, Fusciardi J. Preoperative assessment for difficult intubation in general and ENT surgery: predictive value of a clinical multivariate risk index. Br J Anaesth. 1998;80:140-146. doi:https://doi.org/10.1093/bja/80.2.140
- Cook T, Woodall N, Frerk C. Major complications of airway management in the UK: results of the Fourth National Audit Project of the Royal College of Anaesthetists and the Difficult Airway Society. Part 1: anaesthesia. Br J Anaesth. 2011;106:617-631. doi:https://doi.org/10.1093/bja/aer058
- Roth D, Pace N, Lee A. Airway physical examination tests for detection of difficult airway management in apparently normal adult patients. Cochrane Database Syst Rev. 2018;5. doi:https://doi.org/10.1002/14651858.CD008874.pub2
- Apfelbaum J, Hagberg C, Caplan R. Practice guidelines for management of the difficult airway: an updated report by the American Society of Anesthesiologists Task Force on Management of the Difficult Airway. Anesthesiology. 2013;118:251-270. doi:https://doi.org/10.1097/ALN.0b013e31827773b
- Higgs A, McGrath B, Goddard C. Guidelines for the management of tracheal intubation in critically ill adults. Br J Anaesth. 2018;120:323-352. doi:https://doi.org/10.1016/j.bja.2017.10.021
- Griesdale D, Liu D, McKinney J. Glidescope® video-laryngoscopy versus direct laryngoscopy for endotracheal intubation: a systematic review and meta-analysis. Can J Anaesth. 2012;59:41-52. doi:https://doi.org/10.1007/s12630-011-9620-5
- Wandell G, Merati A, Meyer T. Update on tracheostomy and upper airway considerations in the head and neck cancer patient. Surg Clin North Am. 2022;102:267-283. doi:https://doi.org/10.1016/j.suc.2021.12.005
- Eissner F, Haymerle G, Brunner M. Risk factors for acute unplanned tracheostomy during panendoscopy in HNSCC patients. PLoS One. 2018;13. doi:https://doi.org/10.1371/journal.pone.0207171
- Sagiv D, Nachalon Y, Mansour J. Awake tracheostomy: indications, complications and outcome. World J Surg. 2018;42:2792-2799. doi:https://doi.org/10.1007/s00268-018-4578-x
- Goldenberg D, Golz A, Netzer A. Tracheotomy: changing indications and a review of 1,130 cases. J Otolaryngol. 2002;31:211-215. doi:https://doi.org/10.2310/7070.2002.21091
- Altman K, Waltonen J, Kern R. Urgent surgical airway intervention: a 3 year county hospital experience. Laryngoscope. 2005;115:2101-2104. doi:https://doi.org/10.1097/01.mlg.0000180176.66968.0f
- Bathula S, Srikantha L, Patrick T. Immediate postoperative complications in adult tracheostomy. Cureus. 2020;12. doi:https://doi.org/10.7759/cureus.12228
- Jotic A, Milovanovic J, Trivic A. Predictors of complications occurrence associated with emergency surgical tracheotomy. Otolaryngol Head Neck Surg. 2021;164:346-352. doi:https://doi.org/10.1177/0194599820947001
- Karle W, Schindler J. Surgical Management of the Difficult Adult Airway. Elsevier Inc; 2010. doi:https://doi.org/10.1016/b978-0-323-05283-2.00011-2
- Xu Z, Ma W, Hester D. Anticipated and unanticipated difficult airway management. Curr Opin Anaesthesiol. 2018;31:96-103. doi:https://doi.org/10.1097/ACO.0000000000000540
- Chen L, Yang L, Tian W. Transnasal humidified rapid insufflation ventilatory exchange with nasopharyngeal airway facilitates apneic oxygenation: a randomized clinical noninferiority trial. Front Med (Lausanne). 2020;7. doi:https://doi.org/10.3389/fmed.2020.577891
- Iseli T, Iseli C, Golden J. Outcomes of intubation in difficult airways due to head and neck pathology. Ear Nose Throat J. 2012;91:E1-E5. doi:https://doi.org/10.1177/014556131209100313
- Rosenblatt W, Ianus A, Sukhupragarn W. Preoperative endoscopic airway examination (PEAE) provides superior airway information and may reduce the use of unnecessary awake intubation. Anesth Analg. 2011;112:602-607. doi:https://doi.org/10.1213/ANE.0b013e3181fdfc1c
- Cherian V, Vaida S. Airway management in laryngeal surgery. Oper Tech Otolaryngol Neck Surg. 2019;30:249-254. doi:https://doi.org/10.1016/j.otot.2019.09.005
- Filauro M, Mora F, Vallin A. Evone® Flow controlled ventilation: a new device for laryngotracheal surgery. Acta Otorhinolaryngol Ital. 2022;42:189-193. doi:https://doi.org/10.14639/0392-100X-N1834
- Gandhi S, Ganesuni D, Desai S. Low grade laryngeal chondrosarcoma: clinical presentation, management and short term outcome. Indian J Otolaryngol Head Neck Surg. 2022;74:1893-1895. doi:https://doi.org/10.1007/s12070-020-01891-0
- Piazza C, Del Bon F, Grazioli P. Organ preservation surgery for low- and intermediate-grade laryngeal chondrosarcomas: analysis of 16 cases. Laryngoscope. 2014;124:907-912. doi:https://doi.org/10.1002/lary.24416
- Piazza C, Paderno A, Nicolai P. Conservative surgery for laryngeal chondrosarcoma: a review of the most recently proposed approaches. Curr Opin Otolaryngol Head Neck Surg. 2017;25:93-100. doi:https://doi.org/10.1097/MOO.0000000000000337
- Nagarkar R, Kokane G, Wagh A. Airway management techniques in head and neck cancer surgeries: a retrospective analysis. Oral Maxillofac Surg. 2019;23:311-315. doi:https://doi.org/10.1007/s10006-019-00782-1
- Hyman J, Apatov D, Katz D. A prospective observational study of video laryngoscopy use in difficult airway management. Laryngoscope. 2021;131:82-86. doi:https://doi.org/10.1002/lary.28637
- Evans S, McCahon R. Management of the airway in maxillofacial surgery: part 1. Br J Oral Maxillofac Surg. 2018;56:463-468. doi:https://doi.org/10.1016/j.bjoms.2018.05.011
Downloads
License

This work is licensed under a Creative Commons Attribution-NonCommercial-NoDerivatives 4.0 International License.
Copyright
Copyright (c) 2025 Società Italiana di Otorinolaringoiatria e chirurgia cervico facciale
How to Cite
- Abstract viewed - 2389 times
- PDF downloaded - 482 times