Laryngology
Vol. 46: Issue 2 - April 2026
Acoustic analysis of tracheo-oesophageal voice: cepstral and voicing measures
Authors
Lucia D'Alatri
 , Ylenia Longobardi
, Rosa Libero
, Claudio Parrilla
, Michela Sollazzo
, Maria Raffaella Marchese
, Jacopo Galli
, Ylenia Longobardi
, Rosa Libero
, Claudio Parrilla
, Michela Sollazzo
, Maria Raffaella Marchese
, Jacopo Galli
Summary
Cover Image
Objectives. To develop an acoustic analysis protocol examining the correlations between acoustic and perceptual parameters in tracheo-oesophageal (TE) voices.
Methods. Forty-nine laryngectomised patients with TE voice (42 M, 7 F; mean age 68 ± 9.3 years) were enrolled. Voice samples holding the sustained vowel /a/ and the Consensus Auditory-Perceptual Evaluation of Voice (CAPE-V) sentences were recorded and analysed to extract the fundamental frequency (F0), the fraction of locally unvoiced frames (FLUF) and the cepstral peak prominence smoothed (CPPS). A perceptual evaluation was performed with the Impression, Noise, Fluency and quality of Voice (INFVo) scale.
Results. CPPS and FLUF did not significantly correlate with F0. Average F0 on connected speech showed moderate correlations with I and Vo parameters (INFVo). Strong correlations between CPPS and FLUF were observed on both sustained vowel and connected speech. FLUF and CPPS moderately correlated with the I and Vo parameters; FLUF showed also a moderate correlation with the N parameter.
Conclusions. CPPS and FLUF are evaluable on both sustained vowel and connected speech and are easy to analyse. The intercorrelation between them and the correlations with perceptual evaluation suggest their validity for TE voice assessment.
Introduction
The tracheo-oesophageal (TE) voice is produced after total laryngectomy (TL) via a voice prosthesis (VP) that diverts pulmonary airflow towards the neopharynx, allowing mucosal vibration and voice production. TE voice is considered the gold standard rehabilitation after TL due to the high success rate and better voice quality compared to electrolarynx and oesophageal speech. The TE voice is a substitution voice (SV) and it cannot be adequately assessed with traditional methods used for “common” voice disorders 1. SVs in general and TE voices in particular can be evaluated using different methods 2-5. Even today there is no shared and standardised protocol for evaluating the results of VP rehabilitation. While reliable and valid tools have been developed for self-assessment (Self-Evaluation of Communication Experiences after Laryngectomy, SECEL 6) and perceptual evaluation (Impression, Noise, Fluency and quality of Voice [INFVo] scale 7 for SVs and Sunderland TE perceptual scale - STOP specific for the TE voices 8), in acoustic analysis it is not clear which method and which indices should be used.
In 1995, Titze 9 classified the acoustic signal into 3 types and suggested that only type 1 signals (i.e., quasi-periodic) are suitable for perturbation analysis. In 2010, Sprecher et al. 10 changed this classification by introducing 4 categories of voices based on spectrographic analysis. These categories were: type 1 voices (periodic without strong modulations or subharmonics); type 2 voices (with strong modulations, bifurcations or subharmonics); type 3 voices (energy dispersion through harmonics with visible fundamental frequency and 1 or 2 harmonics); type 4 voices (aperiodic). Only types 1 and 2 are considered suitable for perturbation analysis (jitter%, shimmer% and harmonics/noise ratio).
The TE voice signal may be strongly aperiodic and its fundamental frequency (F0) extremely low and sometimes unreliable. For these reasons, some authors claim that a perturbation analysis that derives time-based acoustic measurements from pitch detection algorithms can be performed on no more than 30% of TE voices 11.
On the contrary, spectral or cepstral measures appear to be useful for evaluating very irregular voices and for predicting the severity of dysphonia 12. The cepstral peak prominence (CPP) and its smoothed measure (CPPS) are acoustic measures of speech quality. To create the power “cepstrum”, a Fourier transform of the power spectrum of the voice signal is performed. The cepstral peak is measured in decibels and is the periodic harmonic energy present in the spectrum of the original acoustic source. The more periodic the vocal signal, the more defined the harmonic configuration of the spectrum, and the more prominent the cepstral peak will be.
In 2018, the American Speech-Language-Hearing Association (ASHA) guidelines 13 recommended CPP as an index to “measure the overall level of noise in the vocal signal” and as “a general measure of dysphonia”. In this recommendation, CPP replaces time-based acoustic measures such as jitter and shimmer which can only be extracted from the sustained vowel and are based on F0 computation (less reliable in more than moderate dysphonia). The CPP does not require direct computation of F0 14 and can be extracted from both sustained vowels and connected speech, which is considered more ecologically valid and more representative of everyday speech patterns.
Although cepstral analysis has been around for many decades, it has only become popular in recent years. Several authors have shown that lower CPP values are well correlated with more severe dysphonia based on auditory-perceptual judgments 14,15. To date, only Maryn et al. 16 and Zhang et al. 17 have used cepstral-based measures to assess TE voice.
In addition to cepstral analysis, another interesting acoustic evaluation method that can be applied to evaluate very irregular voices is the so-called “voicing quantification” which has the advantage of being suitable for connected speech. As suggested by the INFVo perceptual rating scale, voicing is an important feature of SVs. Indeed, all these voices are characterised by the coexistence of unvoiced and voiced fragments of speech. Earlier research has shown that it is possible to detect periodicity in very irregular signals with background noise 18,19 and that the acoustic assessment of SVs is better if based on voicing quantification rather than F0 variability 3. Furthermore, while features related to voicing quantification allow distinguishing between several types of SVs generated by distinct anatomical structures, features related to F0 variability do not do so.
Given the widespread use of VP rehabilitation, the need arises to develop an adequate and easily usable acoustic analysis protocol. The aim of this study was to test the validity of cepstral and voicing measures, detected from both the sustained vowel /a/ and the connected speech, through their intercorrelation and a correlation analysis with the perceptual evaluation parameters.
Materials and methods
Design
This is a cross-sectional cohort study (STROBE reporting guidelines).
Setting and participants
Forty-nine patients (42 males and 7 females), with a mean age of 68 ± 9.3 years (range 34-85 years), who underwent TL and placement of an indwelling low-resistance voice prosthesis (Provox VEGA, 22,5 Fr, Atos Medical AB, Horby, Sweden) were enrolled between March 2024 and November 2024. All participants received pre- and post-operative speech pathologist counseling and 5 to 20 speech therapy sessions.
The inclusion criteria were: age over 18 years, Italian mother tongue, ability to produce the TE voice, ability to provide regular written informed consent. Exclusion criteria were: reading difficulties, presence or suspicion of disease recurrence and other communication problems unrelated to TL.
Voice recording
The speech samples were recorded after:
- verification of the state and correct functioning of the VP, ensuring its cleanliness;
- placement of a new stoma adhesive, if necessary, to avoid any air leaks;
- voice production test to ensure that the voice produced by the patient was representative of his/her typical way of speaking;
- exercise in the reading aloud task to allow familiarisation and to allow to ask explanations if necessary.
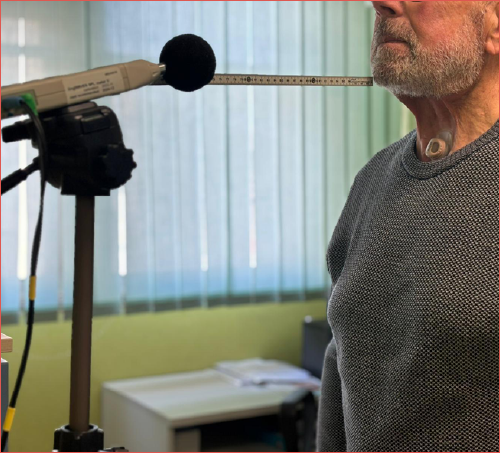
Participants were asked to stand in front of a WEVOSYS sound pressure level (SPL) metre microphone, positioned at a standard distance of 30 cm from the lips and at a 45° angle to the front of the mouth (Cover figure). Recordings were performed in a quiet room (ambient noise < 40 dB) using Lingwaves (Version 3: WEVOSYS medical technology GmbH – Germany). The microphone was connected to a personal computer (Lenovo IdeaPad 3 15IIL05; Lenovo, Quarry Bay, China) via USB. The personal computer was disconnected from the electrical supply.
Patients were asked to take a deep breath, occlude the heat and moisture exchanger (HME) with a finger and produce at a comfortable volume a sustained vowel /a/ longer than 4 seconds as well as the 5 sentences of the Italian version of the Consensus Auditory-Perceptual Evaluation of Voice (CAPE-V) 20.
The acoustic signals were recorded using a sampling rate of 44.1 kHz and a resolution of 16-bit and were saved in *.wav format for later analysis.
Signal-to-Noise ratio (SNR)
The SNR was calculated to ensure the reliability of each recording. According to Deliyski et al.21, a SNR ≥ 42 dB is recommended to keep the relative error in measurements below 1%, although an SNR ≥ 30 dB can still be considered acceptable. As a result of the SNR measurement, the SNR range of the recorded voice samples was 35.81-47.24 dB, with an average value of 40.23 dB. None of the voice samples had an SNR lower than 30 dB.
Acoustic analysis
Acoustic analysis of each voice sample was performed using the free software Praat (version 6.1.50 for Windows, Paul Boersma and David Weenink; Institute of Phonetic Sciences, University of Amsterdam, The Netherlands).
The following acoustics parameters were extracted from the 3 mid seconds of the sustained vowel /a/ and from the first 2 sentences of the Italian version of the CAPE-V:
- the mean fundamental frequency (F0, Hz): using the cross-correlation analysis method, setting the F0 analysis range from 50 to 250 Hz and lowering the voicing threshold to 0.25 and the silence threshold to 0.01 (as per PRAAT instruction). Pitch traces were considered reliable if PRAAT returned values of F0 for at least 2 seconds of the speech sample duration;
- the Fraction of Locally Unvoiced Frames (FLUF,%): this parameter is included in the Praat voice report and reflects the fraction of pitch frames analysed as unvoiced. Its normative value for the sustained vowel /a/ is 0. In fact, normal and healthy voices should have no problem maintaining voicing during a sustained vowel. Normative FLUF values are not available for connected speech which is composed of voiced and unvoiced segments in different proportions depending on the speech material;
- CPPS (dB): this was calculated both from the 3 mid seconds of the sustained vowel /a/ and from the first 2 sentences of the Italian version of the CAPE-V. The free Praat plugin developed by Heller Murray et al. 22 was used. The plugin allows to obtain CPPS values with and without voice detection. In this study only voice-detected CPPS values were calculated. Before analysing the FLUF and the CPPS, we removed the pauses from the sentences using the “Cut” function of the “Edit” menu of Praat.
Perceptual evaluation
Three speech therapists who had not treated any of the patients enrolled in the study performed a blinded perceptual evaluation on the recorded running speech samples (all the 5 sentences of the Italian version of the CAPE-V). All had experience in assessment and rehabilitation of dysphonia and specific experience (> 5 years) in post-TL rehabilitation with VP.
Each recorded speech sample was anonymised and distributed to the raters in a random order, using the “Randomise range” function of the Google Sheets application. Each judge listened to the voices using Sony headphones (model MDR- XD200) and rated them independently. They could listen to the same speech sample no more than 3 times. A 15-minute rest interval was scheduled for every 16 patients to avoid listener fatigue.
The INFVo rating scale, specifically designed for perceptual evaluation of SVs was used 7. The scale includes 4 parameters: 1) overall impression (I); 2) amount of uncontrolled noise (N); 3) fluency (F); 4) quality of voicing (Vo). For each parameter, the score can vary from 0 to 10. The higher the score, the better the perception of voice quality.
Statistical analysis
Statistical analysis was performed using MS Excel spreadsheets (Microsoft Corporation, Redmond, Washington, USA). Descriptive analysis was used for demographic and clinical data using frequencies and percentages for categorical variables and mean ± standard deviation (SD) for quantitative ones.
Inter-judge reliability was verified by calculating Fleiss’ kappa coefficient which was set to 0.61 (substantial agreement).
After checking the assumptions required for its application and performing an outlier analysis, the Pearson correlation coefficient (r) was used to analyse any correlations between perceptual evaluation and acoustic parameters.
Results
Thirty-three of 49 patients (67.3%) underwent TL as a primary procedure (previously untreated cases), and the other 16 (32.6%) in a salvage setting.
A total of 65.3% (32/49) of patients received radiotherapy, which was preoperative in 10 cases (31.2%) and adjuvant in the remaining 22 (68.7%).
All patients underwent TL with primary pharyngeal closure and bilateral neck dissection. All received an indwelling low-resistance prosthesis (Provox Vega, Atos Medical AB, Horby, Sweden), in 42/49 cases (85.7%) by primary TE puncture and in 7/49 (14.2%) by secondary one. The interval between TL and secondary TE puncture ranged from 4 to 36 months (mean 21.1 ± 11.5 months).
The acoustic analysis showed that for 7 of 49 (14.2%) patients it was not possible to analyse the mean F0 on the sustained vowel /a/. In these patients the mean CPPS and FLUF values on the same vowel were extremely low (mean =3.90 ± 0.89 dB; range = 2.8-5.15 dB) and extremely high (mean = 96.15 ± 3.7%; range = 90.86-100%), respectively. In the remaining 42 of 49 (85.7%) patients, the mean F0 value of the sustained vowel /a/ was 101.75 ± 53.83 Hz (range = 51.86-244.83 Hz), the mean value of CPPS was 8.37 ± 3.06 dB (range = 3.04-15.17 dB) and the mean value of FLUF was 44.11 ± 26.8% (range = 0-84.26%). No statistically significant correlation was found between F0 and the 2 acoustic indices under study.
The mean value of F0 on connected speech was evaluable in all the recorded speech samples (mean = 109.81 ± 37.87 Hz; range = 59.67-219.76 Hz) and moderate negative correlations were found between it and the parameters I (r= -0.43) and Vo (r = -0.56) of the INFVo scale.
A strong negative correlation was found between CPPS and FLUF both on the sustained vowel /a/ (r = -0.87) (Fig. 1) and on the connected speech (first 2 sentences of the Italian version of CAPE – V) (r = -0.84) (Fig. 2).
The comparison between the acoustic parameters extracted from connected speech and the perceptual evaluation showed a moderate positive correlation between the mean CPPS values and the parameters I (r = 0.44) (Fig. 3) and Vo (r = 0.58) (Fig. 4) of the INFVo scale as well as a moderate negative correlation between the mean FLUF values and the parameters I (r = -0.44), Vo (r = -0.52) and N (r = -0.36) of the INFVo scale.
A weak positive correlation was found between the mean CPPS values and the N parameter (r = 0.28) of the INFVo scale. Finally, no correlations were found between the mean values of the F parameter of the INFVo scale and the acoustic indices examined.
Table I reports the values of CPPS, FLUF and all the parameters of the INFVo scale.
Discussion
The aim of this paper was to identify acoustic parameters capable of evaluating TE voices and find a correlation with perceptual judgment. For this reason, acoustic measures related to the cepstrum (CPPS) and the quantification of unvoiced frames (FLUF) were analysed on both the sustained vowel /a/ and on connected speech.
The latter is more representative of everyday speech and is particularly important to consider when evaluating TE voices. Indeed, due to the anatomical and vibratory characteristics of the pharyngo-oesophageal segment which do not allow optimal regulation of the expiratory air flow, it is common for TE speakers to have more difficulty in producing a sustained vowel rather than connected speech.
In our study, the F0 was evaluable in 85.7% of patients for the sustained vowel /a/ and in the entire sample for the connected speech. Even if F0 analysis may be problematic in SVs, a recent review by van Sluis et al. 23 has considered F0 among the main acoustic outcomes of TE, oesophageal and electrolaryngeal speech. Furthermore, in this review, 13 studies reported better F0 results for the TE voice. In our case, we probably managed to successfully extract F0 in the vast majority of the samples because of the pitch analysis settings used. In addition, this result may be explained by the well functioning TE voices thanks to the speech therapy performed by each patient (from 5 to 20 sessions).
Although F0 did not show a significant correlation with either CPPS or FLUF, moderate negative correlations were found with the I and Vo parameters of the INFVo scale. It is known that the first parameter reflects the overall quality of the voice, while the second indicates whether the voice is voiced or unvoiced. Therefore, this finding could suggest that a higher F0 may be indicative of a more tense voice, so perceived and judged as less voiced and of lower quality.
Since many unvoiced speech fragments may be present in TE voices, the amount of voicing should be particularly considered in acoustic analysis. The AMPEX acoustic analysis program 18 used by Dejonckere et al. 3 allows to obtain, from running speech, 4 voicing-related parameters (proportion of voiced frames, proportion of voiced speech frames, voicing evidence and average voicing length), while the Praat acoustic analysis programme allows to calculate only the percentage of unvoiced frames. Although this may seem like a limitation of Praat analysis, the strong negative correlations we found between FLUF and CPPS on both sustained vowel and connected speech suggest not only that voicing influences overall voice quality, but also that the percentage of unvoiced frames is a sufficiently representative index. The lower this percentage, the more the voice signal will present a harmonic configuration, and therefore the CPPS will be higher.
Furthermore, FLUF and CPPS had a moderate correlation with the I and Vo parameters of the INFVo perceptual rating scale and the FLUF index also showed a moderate negative correlation with the N parameter. Given the difficulty, in general, in finding a correlation between acoustic and perceptual evaluation in any type of voice disorder 19,24, the presence of even a moderate correlation indicates that it is clinically feasible and valid to use these 2 acoustic indices to assess TE voices.
The poor correlations between the acoustic and perceptual fields 11,19,24 are often attributed to the fact that these are located on 2 distinct levels, respectively physical and perceptive 13, or to the poor reliability of the perceptual evaluation, especially for TE voices 16. Instead, these difficulties could be due to the different speech material on which the acoustic and perceptual assessment are usually carried out (sustained vowel for the former vs. connected speech for the latter). The possibility of extracting the acoustic parameters proposed in this study from both sustained vowel and connected speech and of investigating any correlation makes them worthy of interest for the evaluation of TE voices.
To date, cepstrum-based measures have received little attention for TE voice assessment. Maryn et al. 16 in a sample of 16 TE speakers found that CPP and CPPS had the strongest correlations with TE voice quality. After editing and concatenating the continuous speech (2 sentences of a text) with the middle 3 seconds of the sustained vowel /a/, they used that speech sample to perform the acoustic analysis and the auditory perceptual evaluation. For the latter, only the overall degree of voice quality was taken into consideration. Zhang et al. 17 analysed the CPP over the entire duration of the sustained vowel /a/ of 15 TE speakers. They found a negative correlation between CPP and the Voice Symptom Scale score, suggesting the impact of poor voice quality on the patient’s voice-related quality of life.
Although conventional acoustic parameters such as jitter%, shimmer%, and NHR have historically been used in voice assessment, their reliability raised some concerns even in the evaluation of common dysphonia 25. These measures can be assessed only on sustained vowels. Moreover, they are only valid for mild-to-moderate dysphonia and require a long sustained vowel produced with steady pitch and loudness. In light of these limitations – and consistent with ASHA’s 2018 recommendations – we deemed it unnecessary to include these measures in our analysis. Therefore, rather than demonstrating the inferiority of traditional parameters through additional analysis, we prioritised analysis of measures (CPPS and FLUF) that could better align with the specific challenges of TE voice.
The strengths of our study are the large sample size, the use of a specific rating scale for TE voices whose validity is recognised by the international scientific community, analysis of the same acoustic parameters on vowels and connected speech, and use of the Praat software which can be downloaded for free and therefore with high accessibility.
Considering the results obtained, it might be useful in the future to stratify the sample of TE speakers to be analysed with the indices suggested in this study, taking into account all the variables that can influence the vocal outcome (for example radiotherapy, surgical approach, etc.), as well as to use the same method to evaluate other SVs, in order to ascertain the validity of this type of acoustic analysis and to include it in a shared evaluation protocol.
Conclusions
The results obtained allow to consider the CCPS and the FLUF as 2 easy-to-use and valid acoustic indexes in the evaluation of TE voices, as well as worthy of greater attention and further research to use them in a shared way in the field of SVs in general.
Conflict of interest statement
The authors declare no conflict of interest.
Funding
This research did not receive any specific grant from funding agencies in the public, commercial, or not-for-profit sectors.
Author contributions
LD’A: designed the work; LD’A, YL, RL, CP, MS, MRM: acquired and analysed data; LD’A, YL, RL: drafted and all authors revised the manuscript; JG: approved the final version.
Ethical consideration
This study was approved by the Ethics Committee “Università Cattolica del Sacro Cuore” (protocol number 6588).
The research was conducted ethically, with all study procedures being performed in accordance with the requirements of the World Medical Association’s Declaration of Helsinki.
Written informed consent was obtained from each participant/patient for study participation and data publication.
History
Received: May 2, 2025
Accepted: July 27, 2025
Figures and tables
Figure 1. Sustained vowel /a/: strong negative correlation (r = -0.87) between CPPS and FLUF.
Figure 2. Connected speech: strong negative correlation (r = -0.84) between CPPS and FLUF.
Figure 3. Moderate positive correlation (r = 0.44) between CPPS and the I parameter of the INFVo scale.
Figure 4. Connected speech: moderate positive correlation (r = 0.58) between CPPS and the Vo parameter of the INFVo scale.
| Acoustic parameters | Mean (± SD) | Range |
|---|---|---|
| FLUF (%) /a/ | 51.70 (± 31.50) | 0-100 |
| FLUF (%) /connected speech/ | 55.52 (± 22.66) | 13.24-95.96 |
| CPPS (dB) /a/ | 7.79 (± 3.42) | 2.80-15.17 |
| CPPS (dB) /connected speech/ | 6.12 (± 2.04) | 2.81-10.48 |
| INFVo scale parameters | ||
| I | 6.39 (± 1.71) | 3-10 |
| N | 6.68 (± 2.10) | 2.33-10 |
| F | 7.49 (± 1.88) | 3-10 |
| Vo | 5.06 (± 2.34) | 0.33-9.67 |
References
- Dejonckere P, Bradley P, Clemente P. A basic protocol for functional assessment of voice pathology, especially for investigating the efficacy of (phonosurgical) treatments and evaluating new assessment techniques. Guideline elaborated by the Committee on Phoniatrics of the European Laryngological Society (ELS). Eur Arch Otorhinolaryngol. 2001;258:77-82. doi:https://doi.org/10.1007/s004050000299
- D’Alatri L, Bussu F, Scarano E. Objective and subjective assessment of tracheoesophageal prosthesis voice outcome. J Voice. 2012;26:607-613. doi:https://doi.org/10.1016/j.jvoice.2011.08.013
- Dejonckere P, Moerman M, Martens J. Voicing quantification is more relevant than period perturbation in substitution voices: an advanced acoustical study. Eur Arch Otorhinolaryngol. 2012;269:1205-1212. doi:https://doi.org/10.1007/s00405-011-1900-8
- Van Sluis K, van Son R, van der Molen L. Multidimensional evaluation of voice outcomes following total laryngectomy: a prospective multicenter cohort study. Eur Arch Otorhinolaryngol. 2021;278:1209-1222. doi:https://doi.org/10.1007/s00405-020-06216-z
- D’Alatri L, Longobardi Y, Parrilla C. Long-term voice outcomes and quality of life after open partial horizontal laryngectomy type II vs. total laryngectomy: a cross-sectional study. Clin Otolaryngol. 2022;47:464-470. doi:https://doi.org/10.1111/coa.13924
- Schindler A, Mozzanica F, Brignoli F. Reliability and validity of the Italian self-evaluation of communication experiences after laryngeal cancer questionnaire. Head Neck. 2013;35:1606-1615. doi:https://doi.org/10.1002/hed.23198
- Moerman M, Martens J, Crevier-Buchman L. The INFVo perceptual rating scale for substitution voicing: development and reliability. Eur Arch Otorhinolaryngol. 2006;26:435-439. doi:https://doi.org/10.1007/s00405-005-1033-z
- D’Alatri L, Longobardi Y, Marchese M. Perceptual evaluation of the tracheoesophageal voice: Italian validation of the Sunderland Tracheoesophageal Perceptual Scale. J Voice. Published online 2023. doi:https://doi.org/10.1016/j.jvoice.2023.11.007
- Titze I. Workshop on Acoustic Voice Analysis: Summary Statement. National Center for Voice and Speech; 1995.
- Sprecher A, Olszewski A, Jiang J. Updating signal typing in voice: addition of type 4 signals. J Acoust Soc Am. 2010;127:3710-3716. doi:https://doi.org/10.1121/1.3397477
- Van As C, Hilgers F, Verdonck-de Leeuw I. Acoustical analysis and perceptual evaluation of tracheoesophageal prosthetic voice. J Voice. 1998;12:239-248. doi:https://doi.org/10.1016/s0892-1997(98)80044-1
- Maryn Y, Corthals P, Van Cauwenberge P. Toward improved ecological validity in the acoustic measurement of overall voice quality: combining continuous speech and sustained vowels. J Voice. 2008;24:540-555. doi:https://doi.org/10.1016/j.jvoice.2008.12.014
- Patel R, Awan S, Barkmeier-Kraemer J. Recommended protocols for instrumental assessment of voice: American speech-language-hearing association expert panel to develop a protocol for instrumental assessment of vocal function. Am J Speech Lang Pathol. 2018;27:887-905. doi:https://doi.org/10.1044/2018_AJSLP-17-0009
- Murton O, Hillman R, Mehta D. Cepstral peak prominence values for clinical voice evaluation. Am J Speech Lang Pathol. 2020;29:1596-1607. doi:https://doi.org/10.1044/2020_AJSLP-20-00001
- İncebay Ö, Köse A, Esen Aydinli F. Investigation of the cepstral spectral acoustic analysis for classifying the severity of dysphonia. J Voice. Published online 2023. doi:https://doi.org/10.1016/j.jvoice.2022.12.012
- Maryn Y, Dick C, Vandenbruaene C. Spectral, cepstral, and multivariate exploration of tracheoesophageal voice quality in continuous speech and sustained vowels. Laryngoscope. 2009;119:2384-2394. doi:https://doi.org/10.1002/lary.20620
- Zhang T, Cook I, Szczęśniak M. The relationship between biomechanics of pharyngoesophageal segment and tracheoesophageal phonation. Sci Rep. 2019;9. doi:https://doi.org/10.1038/s41598-019-46223-7
- Van Immerseel L, Martens J. Pitch and voiced/unvoiced determination with an auditory model. J Acoust Soc Am. 1992;91:3511-3526. doi:https://doi.org/10.1121/1.402840
- Moerman M, Pieters G, Martens J. Objective evaluation of the quality of substitution voices. Eur Arch Otorhinolaryngol. 2004;261:541-547. doi:https://doi.org/10.1007/s00405-003-0681-0
- Mozzanica F, Ginocchio D, Borghi E. Reliability and validity of the Italian version of the Consensus Auditory-Perceptual Evaluation of Voice (CAPE-V). Folia Phoniatr Logop. 2013;65:257-265. doi:https://doi.org/10.1159/000356479
- Deliyski D, Shaw H, Evans M. Adverse effects of environmental noise on acoustic voice quality measurements. J Voice. 2005;19:15-28. doi:https://doi.org/10.1016/j.jvoice.2004.07.003
- Heller Murray E, Chao A, Colletti L. A Practical guide to calculating cepstral peak prominence in praat. J Voice. Published online 2022. doi:https://doi.org/10.1016/j.jvoice.2022.09.002
- van Sluis K, van der Molen L, van Son R. Objective and subjective voice outcomes after total laryngectomy: a systematic review. Eur Arch Otorhinolaryngol. 2018;275:11-26. doi:https://doi.org/10.1007/s00405-017-4790-6
- Bertino G, Bellomo A, Miani C. Spectrographic differences between tracheal-esophageal and esophageal voice. Folia Phoniatr Logop. 1996;48:255-261. doi:https://doi.org/10.1159/000266416
- Carding P, Steen I, Webb A. The reliability and sensitivity to change of acoustic measures of voice quality. Clin Otolaryngol Allied Sci. 2004;29:538-544. doi:https://doi.org/10.1111/j.1365-2273.2004.00846.x
Downloads
License

This work is licensed under a Creative Commons Attribution-NonCommercial-NoDerivatives 4.0 International License.
Copyright
Copyright (c) 2026 Società Italiana di Otorinolaringoiatria e chirurgia cervico facciale
How to Cite
- Abstract viewed - 564 times
- PDF downloaded - 91 times